In this ever-evolving world of technology, servers serve as the backbone of the entire field. Whether dealing with monolithic or microservices architecture, from small-scale school projects to large-scale multi-millionaire endeavors, servers play a crucial role in bringing our applications to life.
While we often deploy various applications on EC2 instances for personal or client use, it’s crucial to regularly monitor them once everything is set up. This ensures that our applications continue to function as required.
Various scenarios may arise where our application experiences a surge in traffic, requiring additional CPU or memory resources. Failure to provision these resources promptly may result in service disruptions or blackouts.
Hence, having a proper monitoring and action strategy in place becomes essential. These responsibilities are often handled by Site Reliability Engineers (SREs), who ensure the smooth operation of our sites.
Amazon CloudWatch

Amazon CloudWatch is a web service offered by Amazon Web Services (AWS) that provides monitoring and observability for AWS resources and applications. It allows users to collect and track metrics, collect and monitor log files, and set alarms. CloudWatch can be used to gain insights into the performance and health of AWS resources, as well as to troubleshoot issues and automate responses based on predefined rules.
- Metrics and Alarms
- Logs
- Dashboards
- Events
- Synthetics
- Container Insights
- Application Insights
Getting Started
This tutorial walks you through the installation process on Linux, Ubuntu, and Windows servers, providing a seamless experience for gaining valuable insights into your AWS resources. Additionally, we’ll create dashboards to monitor CPU, Disk, and Memory Utilization for our servers and set up alarms to notify the necessary authorities.
Prerequisites
Before diving into the installation process, ensure you have:
- An AWS account with the necessary permissions to set up the CloudWatch Agent.
- Instances running Linux, Ubuntu, or Windows that you want to monitor.

Initial Setup
Now that our servers are ready, let’s assign the required roles and permissions to allow our servers to send logs and metrics to CloudWatch.
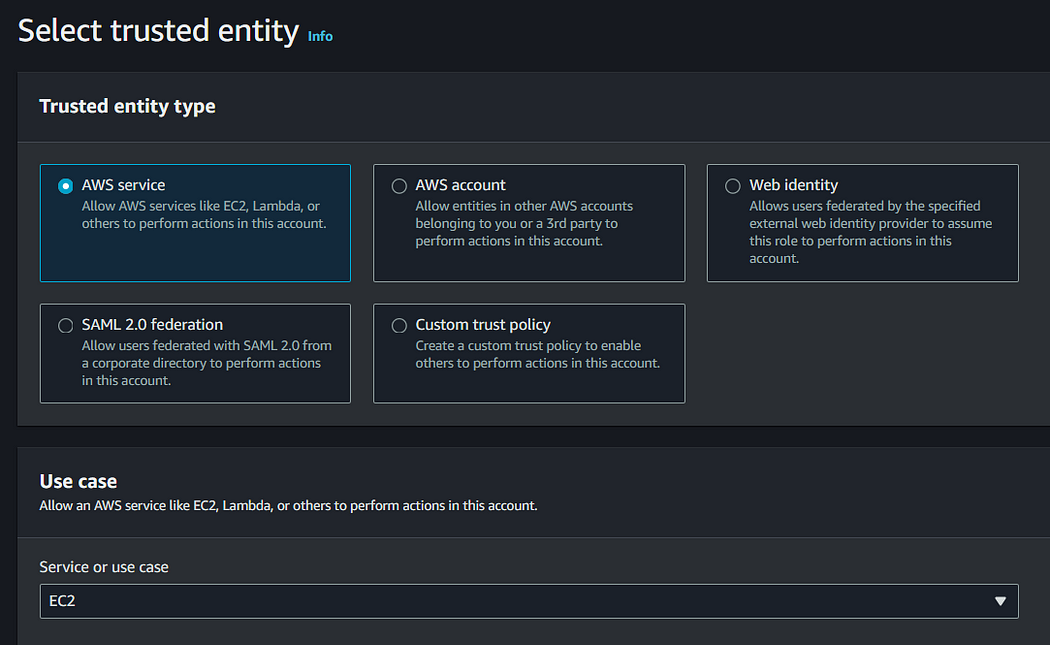
- Go to IAM Console, and create an IAM role.
- Select trusted entity: AWS Service and Use Case: EC2
3. Select the below permissions from the list

4. Enter name and description for your role, and click create.
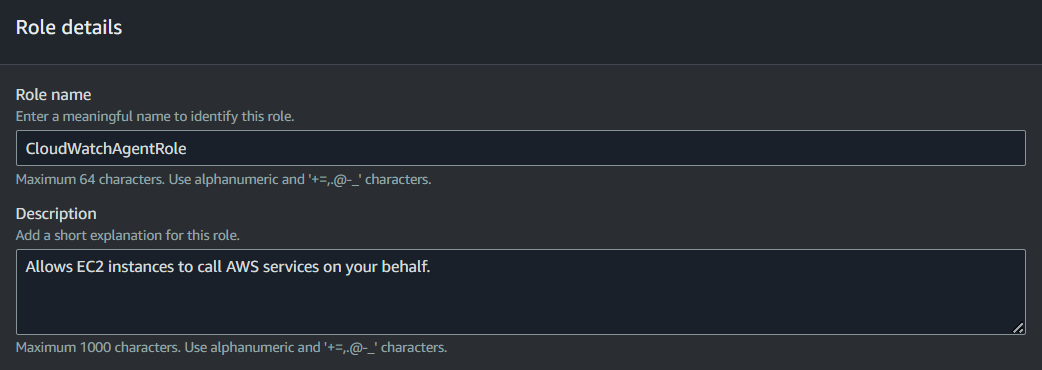

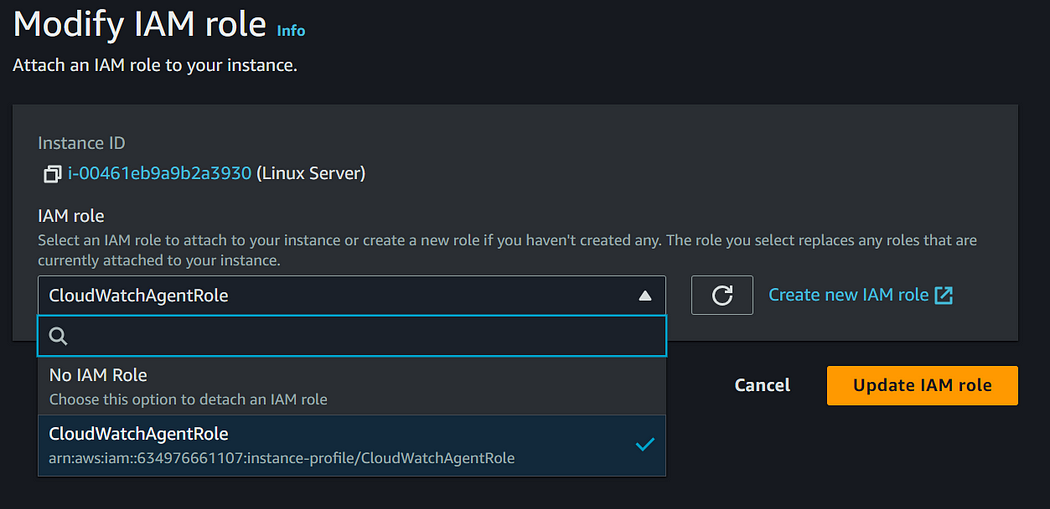
Once the CloudWatchAgentRole is created, assign it to your EC2 instances through the Instances dashboard.
Go to your Instances dashboard, select the required server and click on actions button. Select security, click on modify IAM role and select CloudWatchAgentRole IAM role.
Installation and Configuration
As our role is attached to our servers, it’s time to install and run the CloudWatch agent on each server. Follow the specified set of commands for Linux, Ubuntu and Windows Server
For Linux
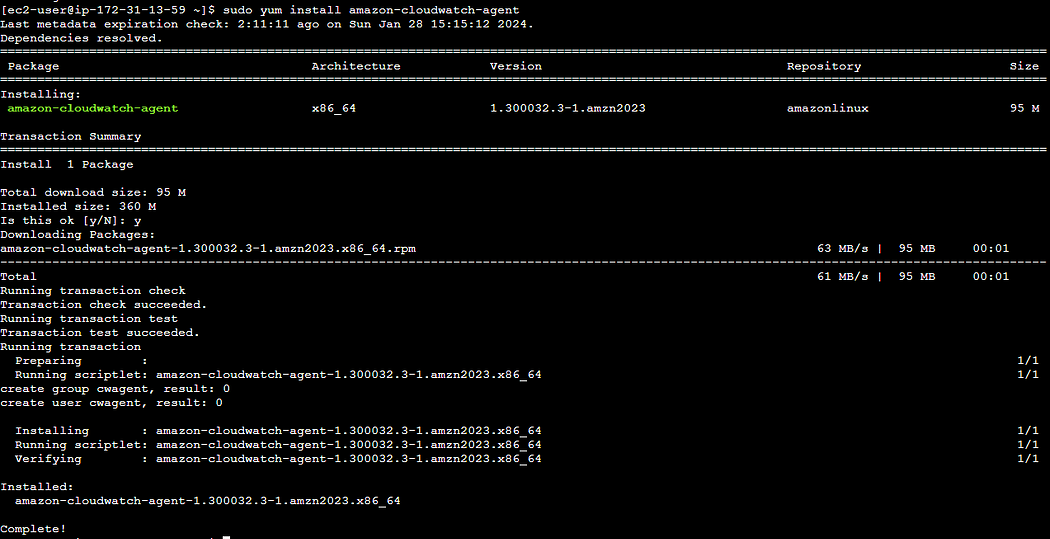
Step 1: Installing cloudwatch agent
sudo yum install amazon-cloudwatch-agent
Step 2: Run the agent configuration wizard
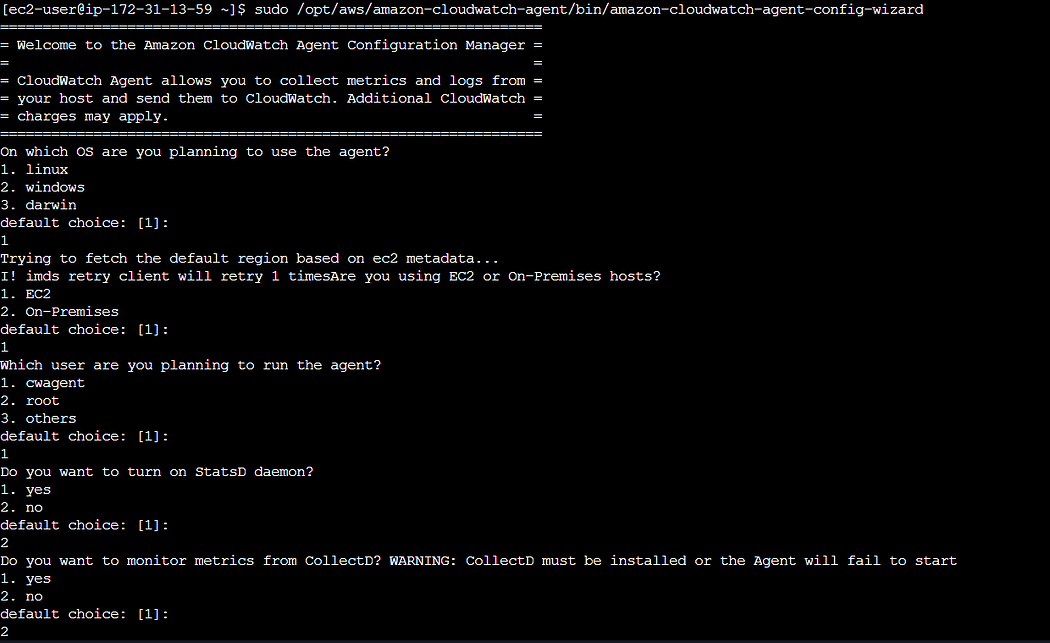
sudo /opt/aws/amazon-cloudwatch-agent/bin/amazon-cloudwatch-agent-config-wizard
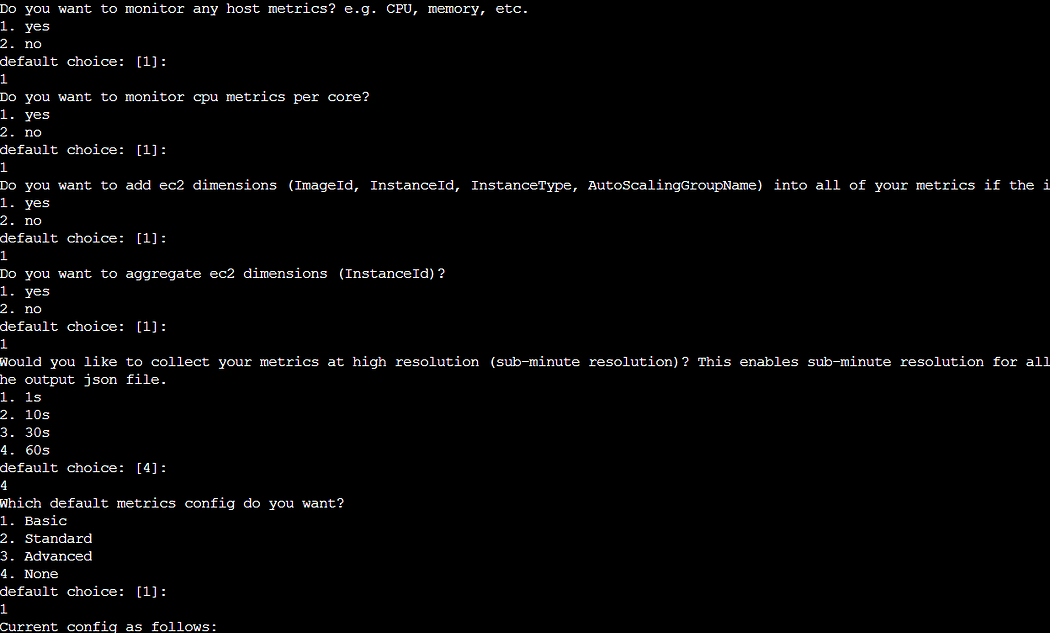
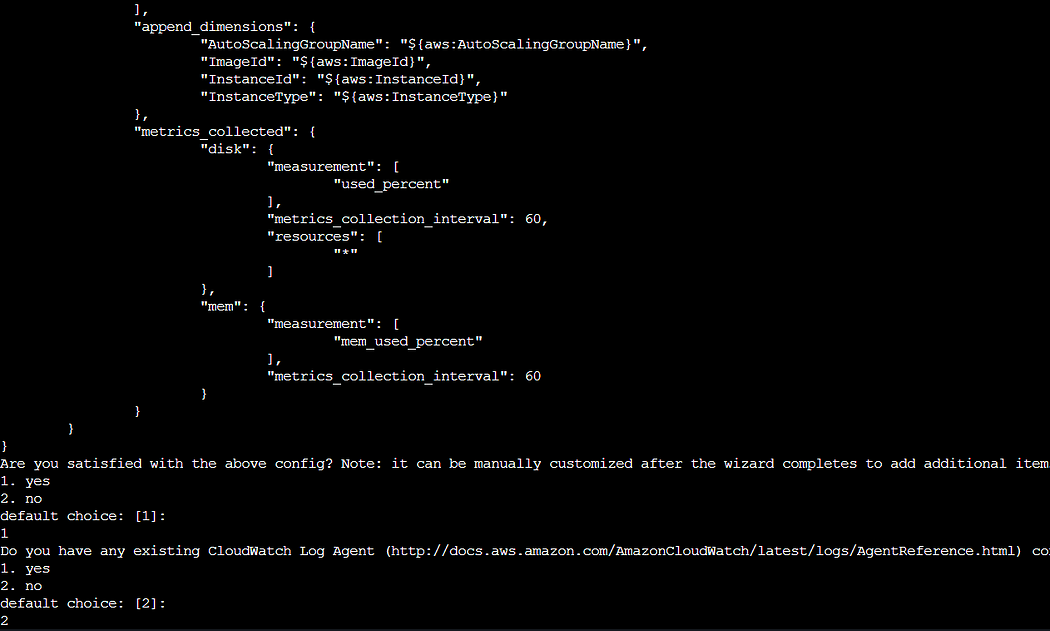
Once configuration wizard start it will prompt to answer certain questions based on the requirements.
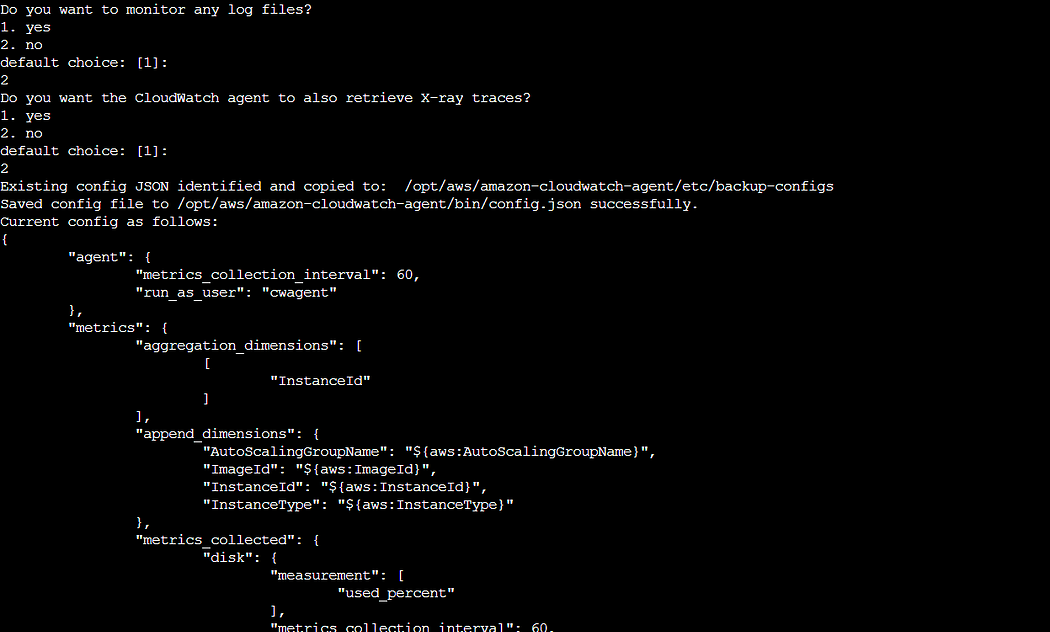
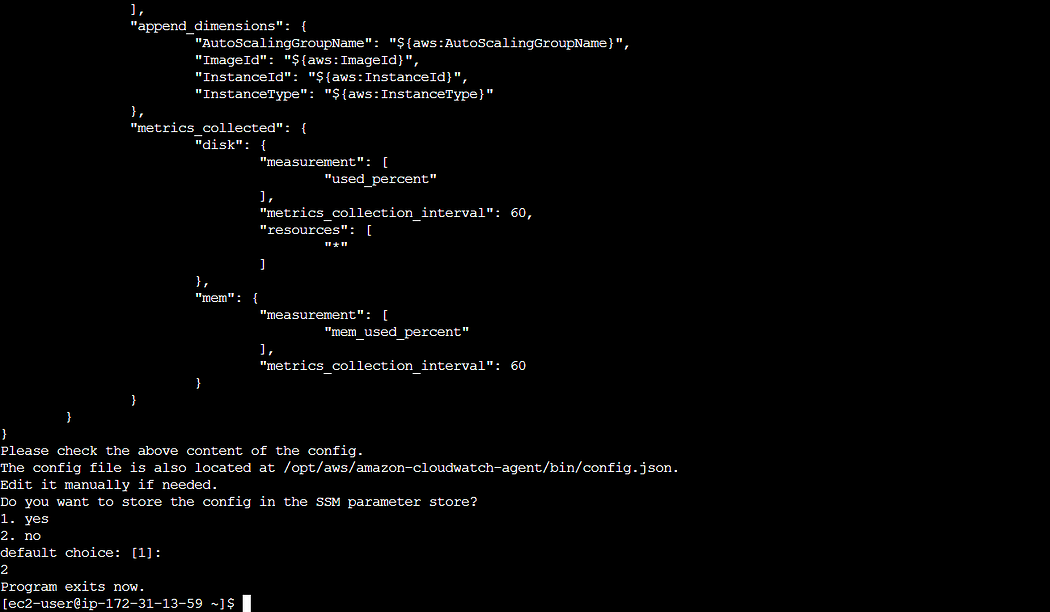
Step 3: Start the agent
sudo /opt/aws/amazon-cloudwatch-agent/bin/amazon-cloudwatch-agent-ctl -a fetch-config -m ec2 -s -c file:/opt/aws/amazon-cloudwatch-agent/bin/config.json -s

Step 4: Check the status of CloudWatch Agent
sudo systemctl status amazon-cloudwatch-agent
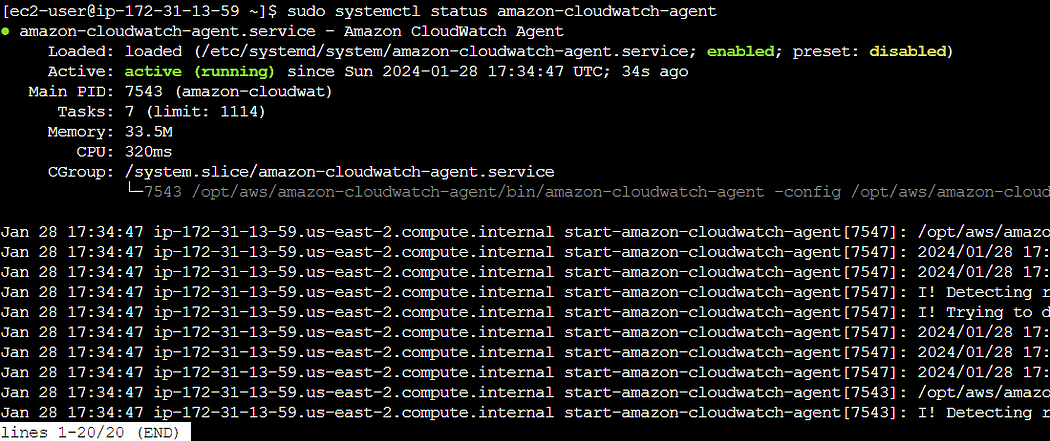
We can see that our cloudwatch agent is in running status.
For Ubuntu
Step 1: Installing cloudwatch agent
sudo wget https://amazoncloudwatch-agent.s3.amazonaws.com/ubuntu/amd64/latest/amazon-cloudwatch-agent.deb
sudo dpkg -i -E ./amazon-cloudwatch-agent.deb

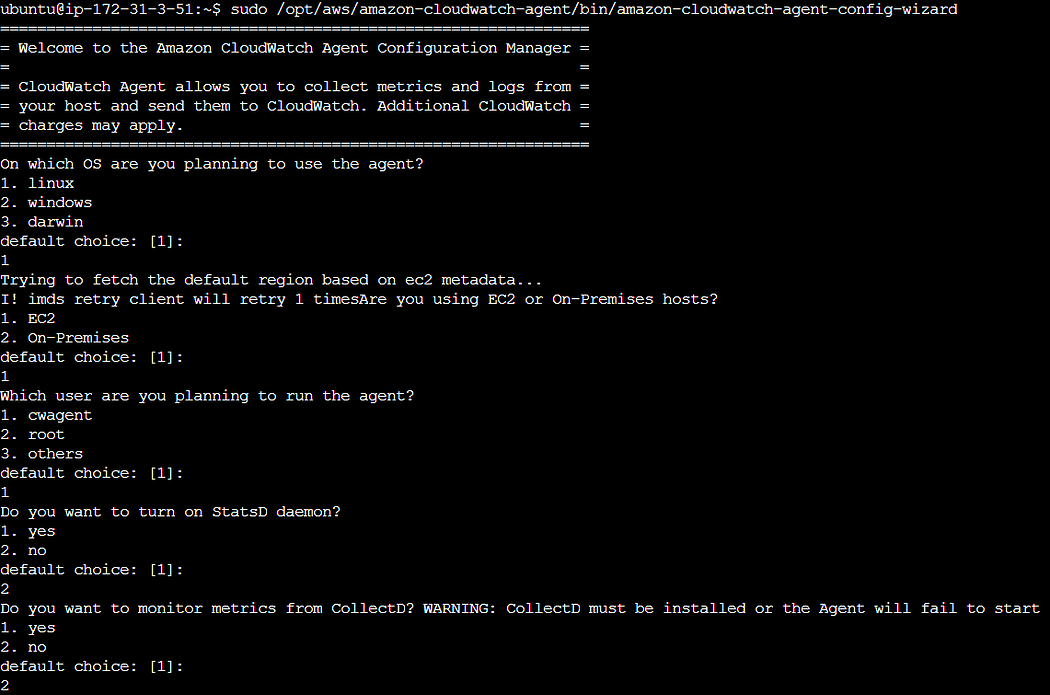
Step 2: Run the agent configuration wizard
sudo /opt/aws/amazon-cloudwatch-agent/bin/amazon-cloudwatch-agent-config-wizard
Answer the configuration setup wizard as per the requirements.
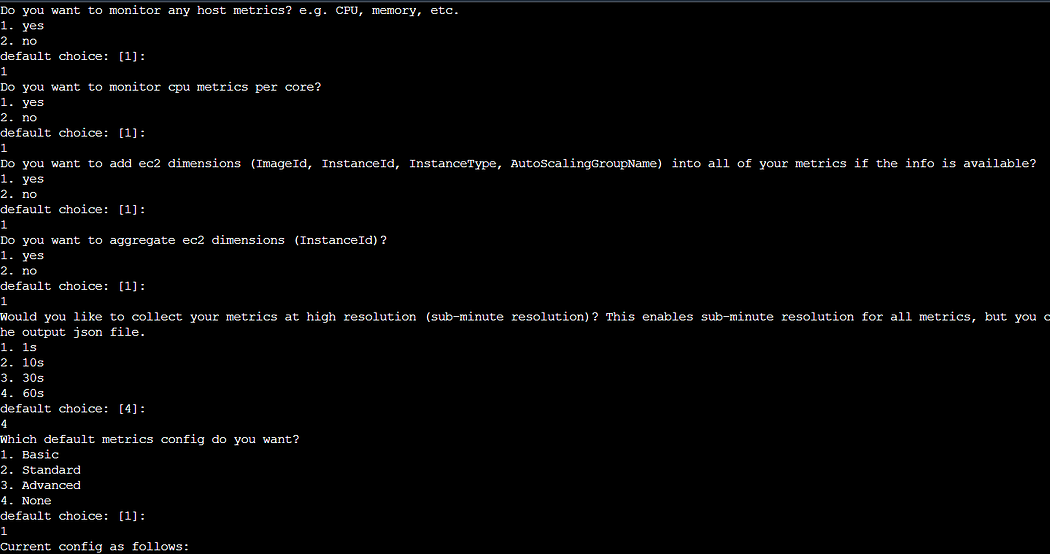
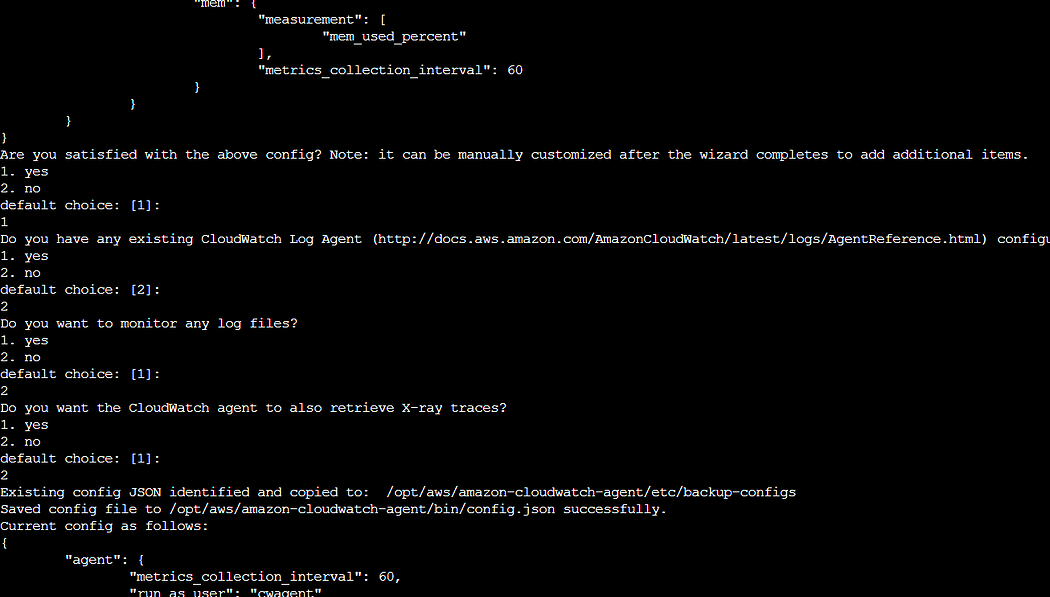
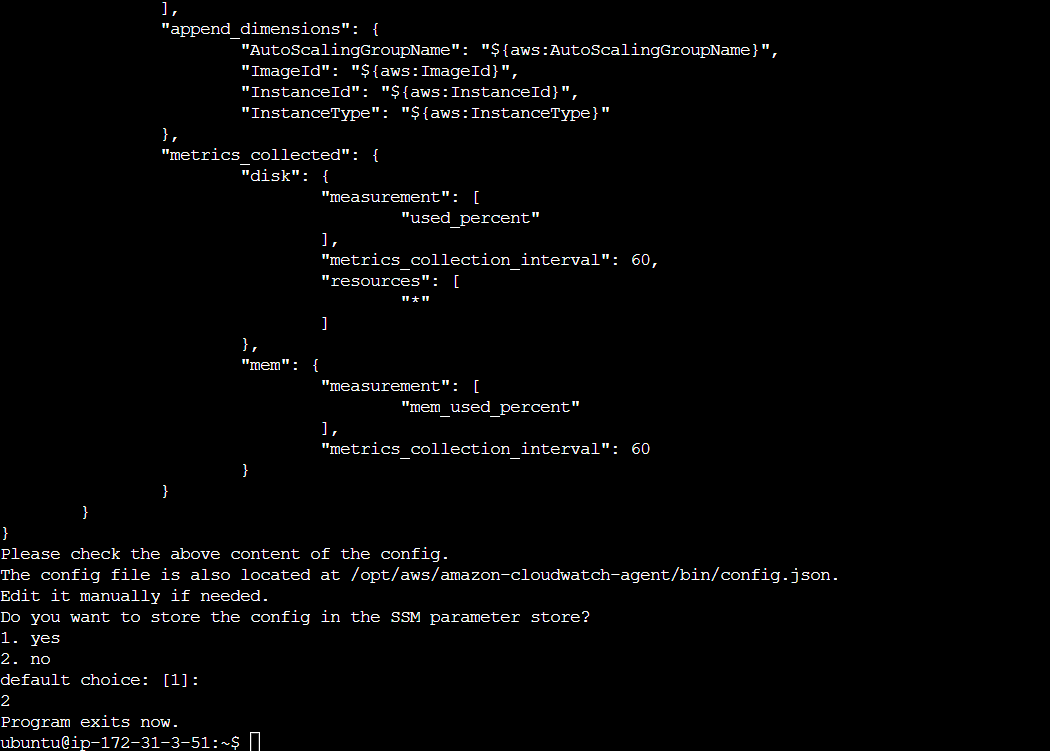
Step 3: Start the agent
sudo /opt/aws/amazon-cloudwatch-agent/bin/amazon-cloudwatch-agent-ctl -a fetch-config -m ec2 -s -c file:/opt/aws/amazon-cloudwatch-agent/bin/config.json -s

Step 4: Check the status of CloudWatch Agent
sudo systemctl status amazon-cloudwatch-agent

For Windows:
Step 1: Installing cloudwatch from the browser by using below url
https://amazoncloudwatch-agent.s3.amazonaws.com/windows/amd64/latest/amazon-cloudwatch-agent.msi
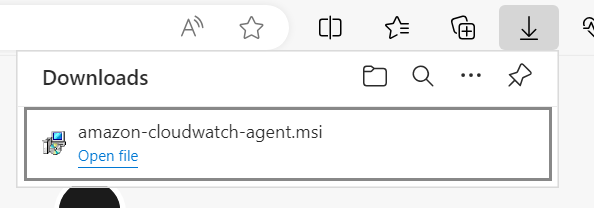
Double click the msi installer to install the cloudwatch agent.
Step 2: Run the agent configuration wizard
Once cloudwatch agent is installation, it will create a AmazonCloudWatchAgent directory similar to what is show below.
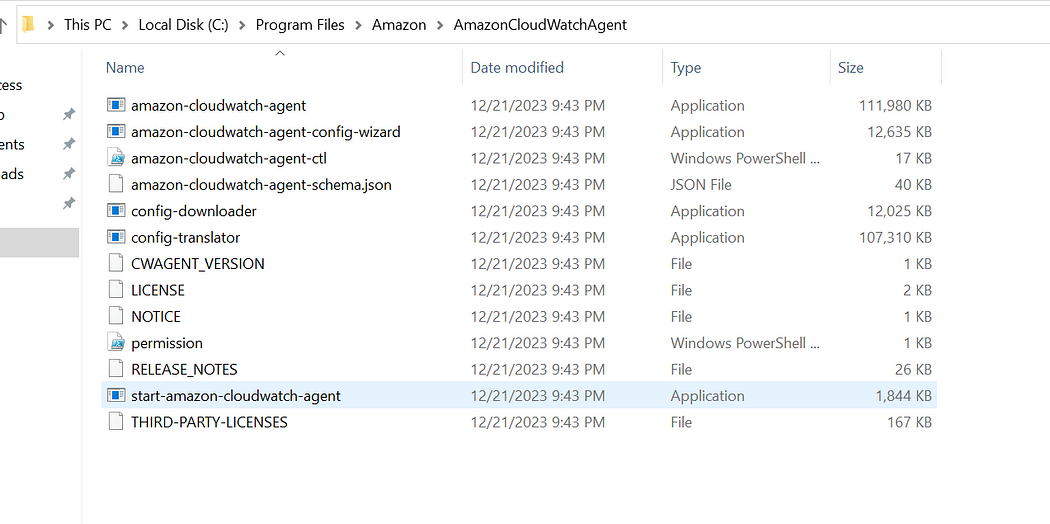
Doble click amazon-cloudwatch-agent-config-wizard to complete the cloudwatch agent setup wizard.
Answer the questions as per the requirements.
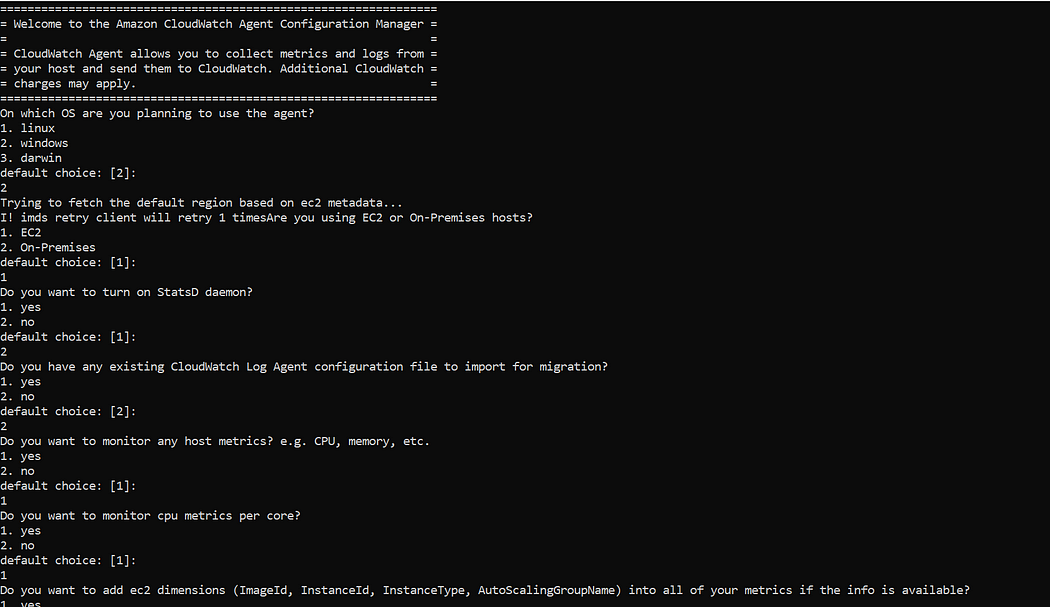
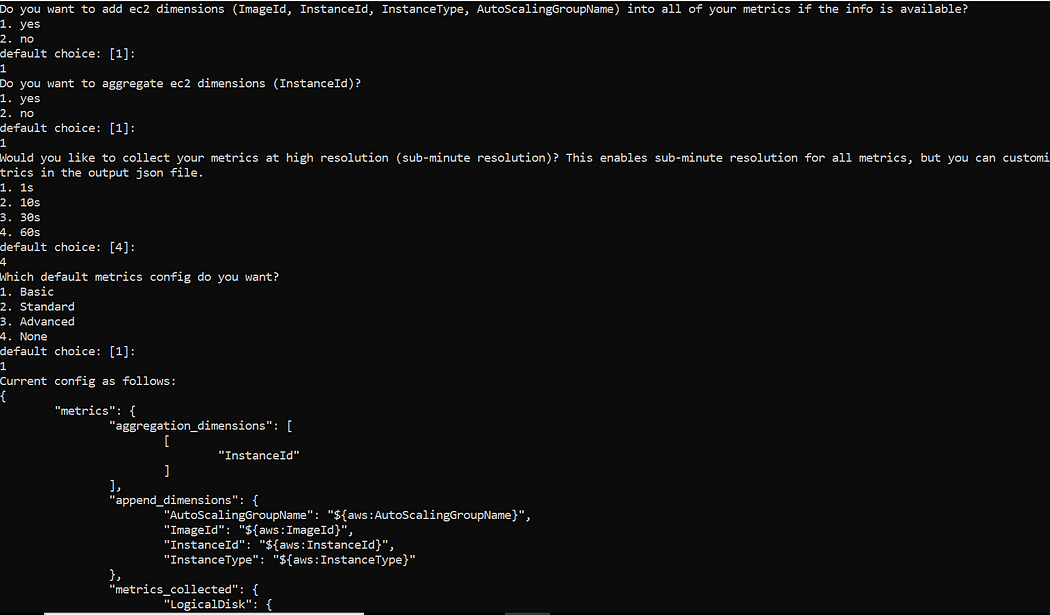
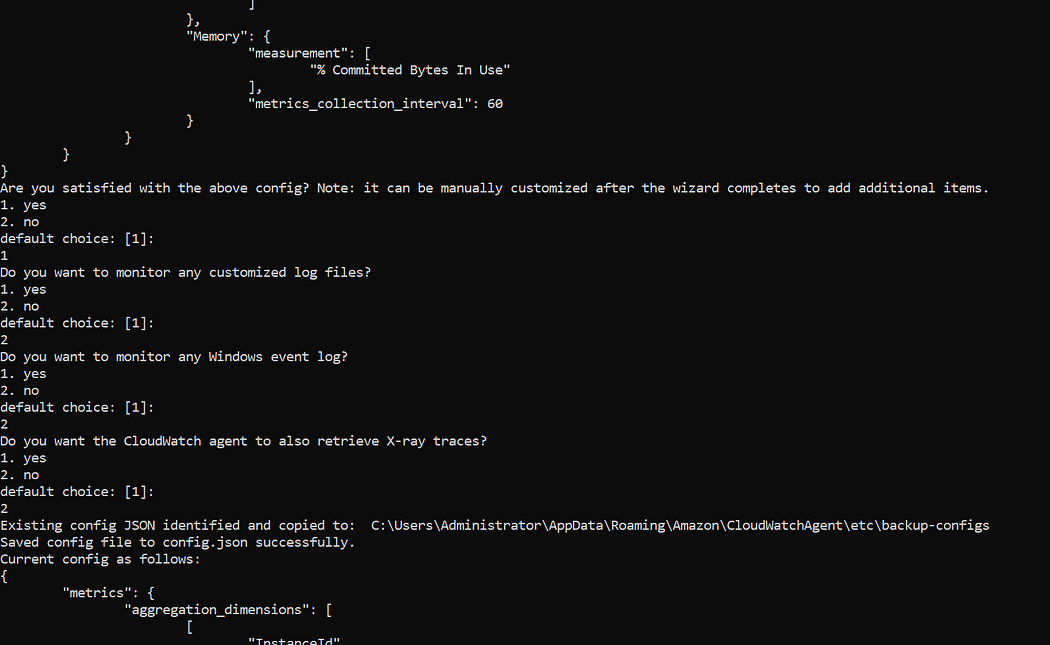
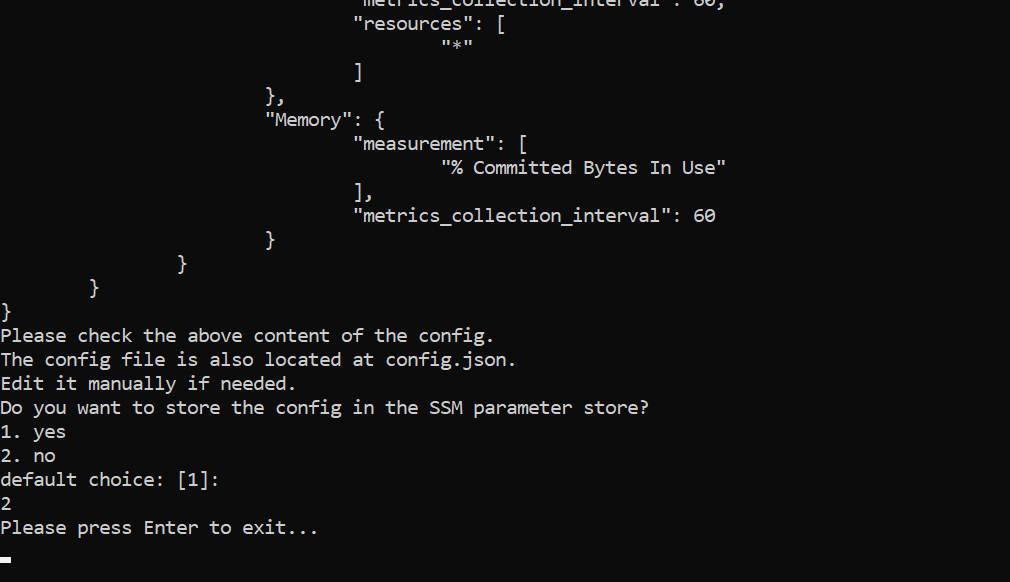
Our setup wizard is done now.
Step 3: Start the agent
Open windows powershell as an administrator and run the following command:
& $Env:ProgramFiles\Amazon\AmazonCloudWatchAgent\amazon-cloudwatch-agent-ctl.ps1 -a fetch-config -m ec2 -c file:'C:\Program Files\Amazon\AmazonCloudWatchAgent\config.json' -s

Step 4: Check the status of CloudWatch Agent
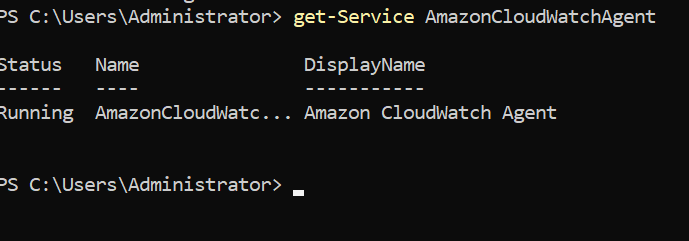
Run the following command in powershell to check the AmazonCloudWatchAgent service status.
get-Service AmazonCloudWatchAgent
Monitoring Dashboards
With the successful installation and running status of the CloudWatch agent on all our servers, we are now ready to explore the metrics for our AWS workloads.
In the Metrics section, a custom namespace is created to collect metrics for the workload where we installed the CloudWatch Agent.
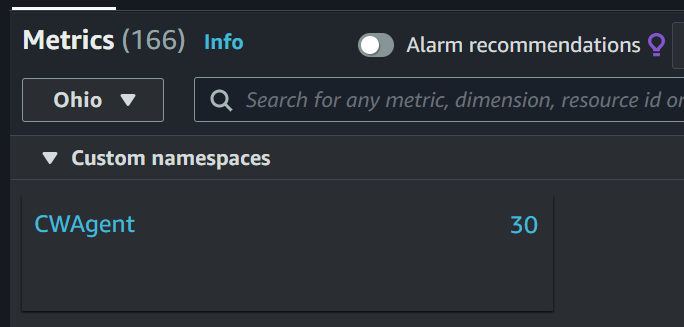
Let’s simplify our monitoring process by creating a dashboard:
- Navigate to the dashboard and click “Create New Dashboard.”
- Provide a name for the dashboard and click on “Add Widget.”
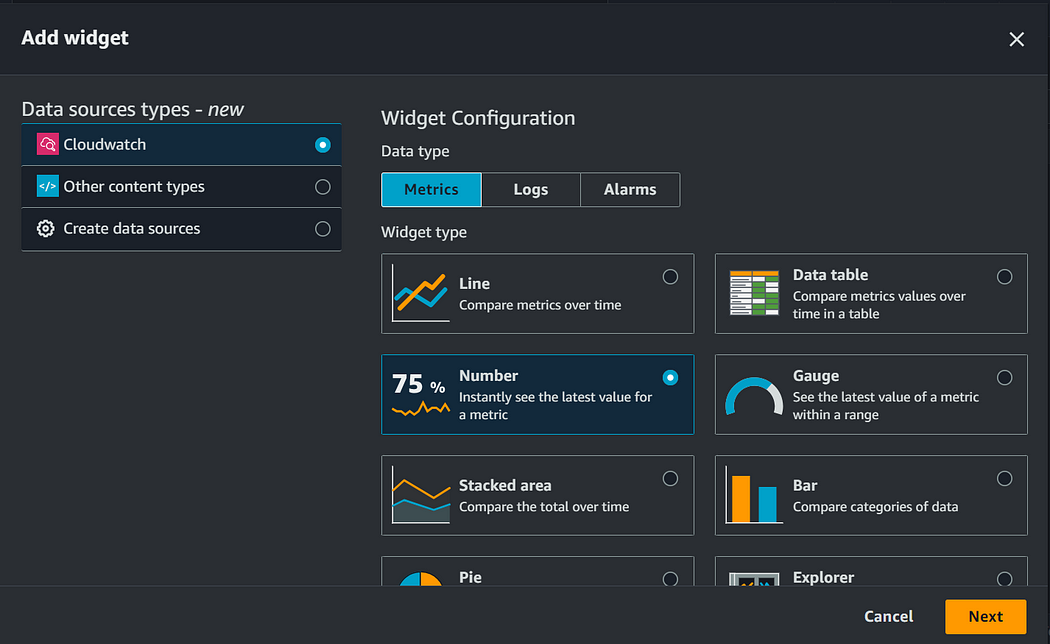
Choose the metrics data type and widget type; for now, I’m opting for the Number widget type.
Let’s begin by selecting Linux Server CPU utilization (AWS Namespace EC2), MEMORY utilization (Custom Namespace CWAgent), and DISK utilization (Custom Namespace CWAgent) metrics to add to our dashboard.

We can observe that gathering information for our Linux server is now easily accessible through this dashboard. Repeat the same process for Ubuntu and Windows Server.
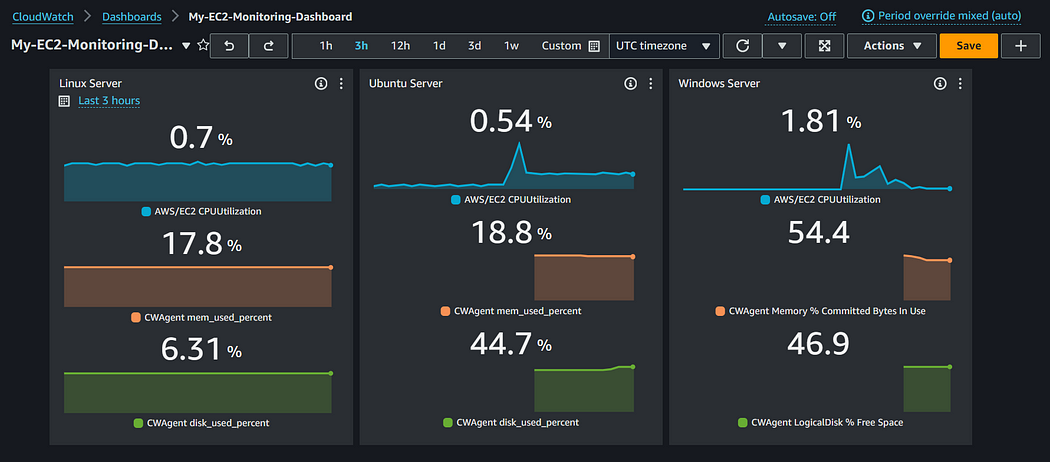
In the end, our dashboard will look like this, providing a convenient way to gather information about our running servers and workloads.
Configuring CloudWatch Alarm
While a monitoring dashboard offers valuable insights, it’s crucial to be notified about critical scenarios, such as CPU utilization exceeding 90% or Disk space reaching 100%, which can disrupt our services.
To address this, we will utilize CloudWatch Alarms:
- Navigate to the Alarms section and click “Create.”
- Specify the Linux server disk used percent metric.
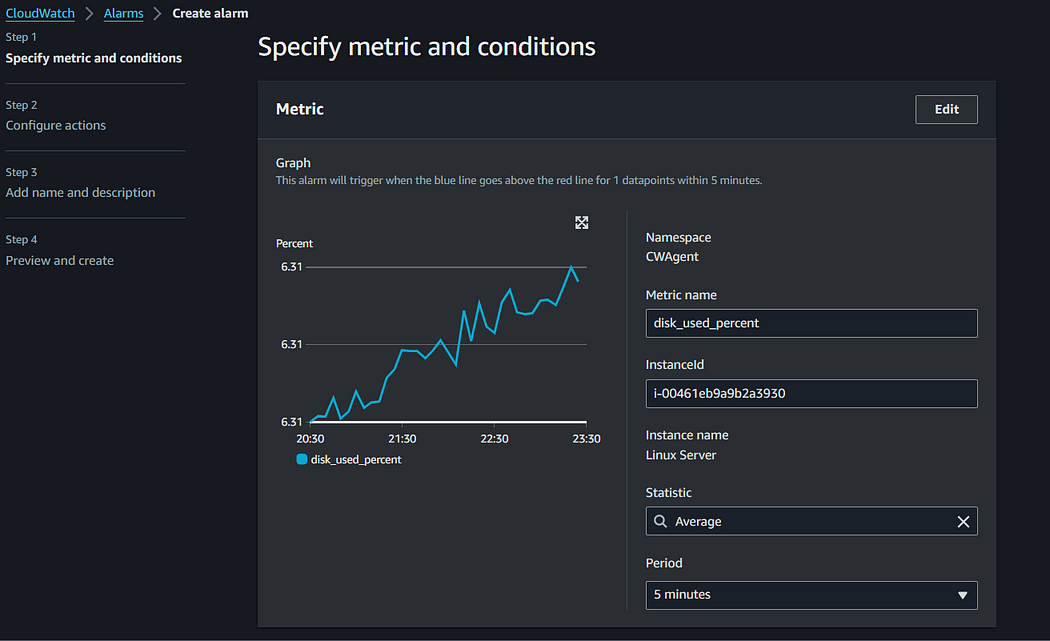
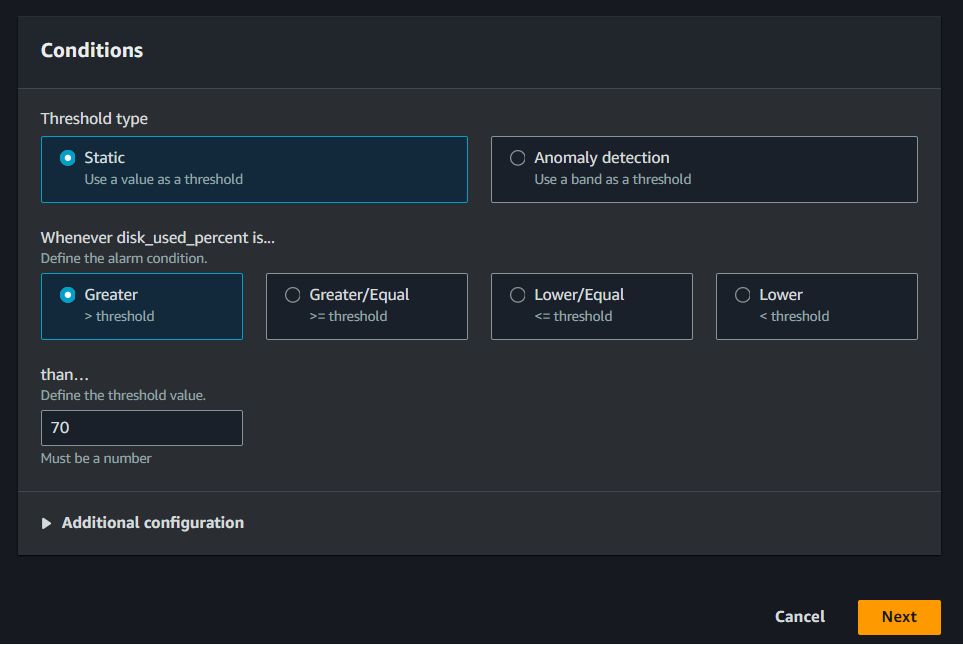
3. For conditions, trigger the alarm for disk used percent greater than the threshold value of 70.
NOTE: For Windows, use the disk % free space metric with the condition being lower than the threshold value of 30.
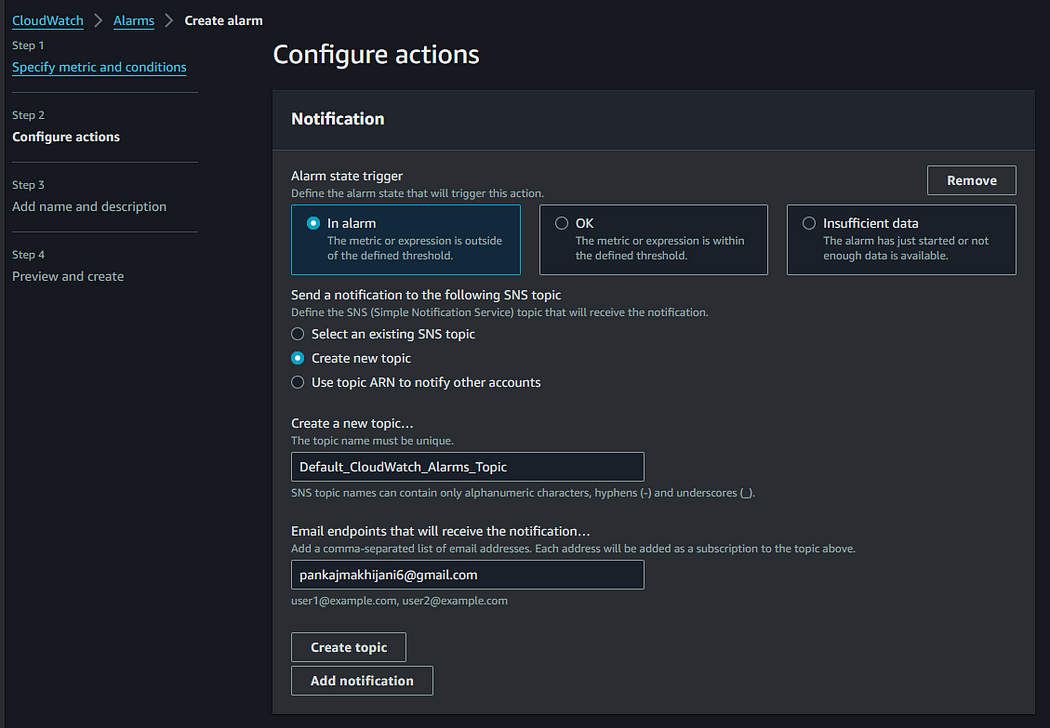
4. For actions, choose the desired action. For now, we’ll opt for sending a notification. Create a new SNS topic and specify the recipient’s email.
5. Provide a name and description for your alarm.
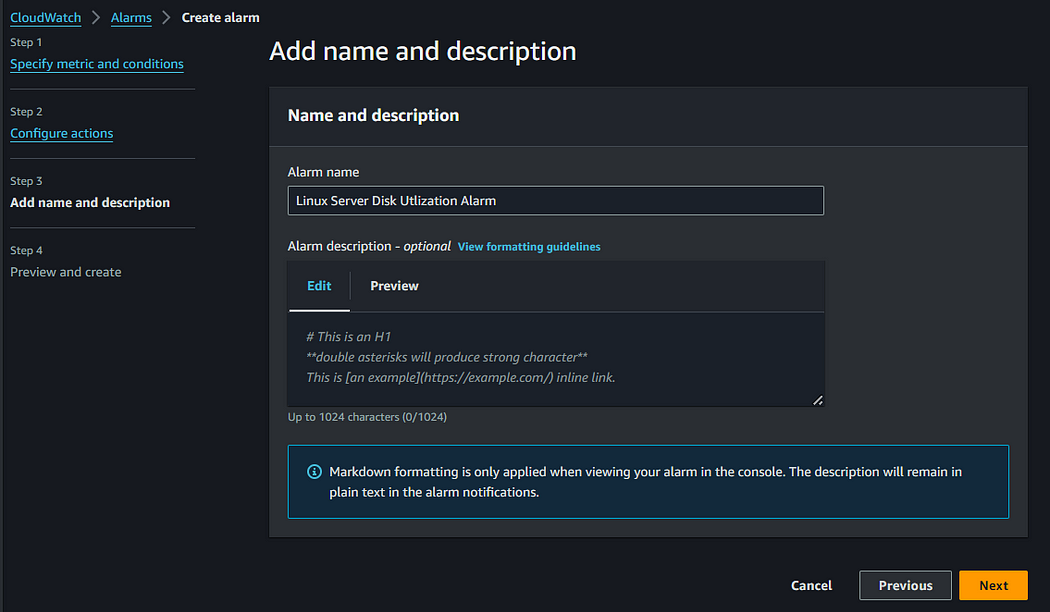
6. Click “Next,” preview, and create. Your alarm for the Linux server is now successfully created. Repeat the same process for Ubuntu and Windows Server.

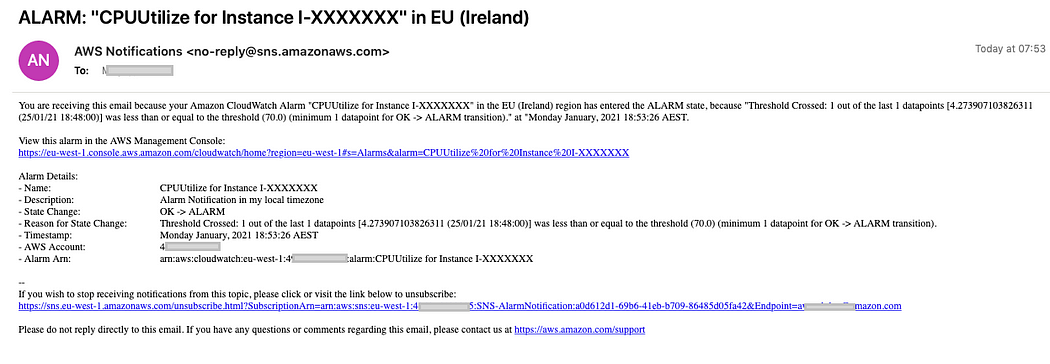
Note: You will receive an email from AWS SNS to confirm your subscription for the Alarm SNS topic. Kindly confirm by clicking on the link; otherwise, AWS won’t send you alarm notifications until you confirm.
Here is the sample alarm notification email that you will receive.
Conclusion
In this blog, we explored seamless monitoring of our AWS workloads by leveraging the power of the Amazon CloudWatch agent. We created visually appealing metric dashboards to gain insights and set up alarms for handling incidents effectively.
We hope you found this content enjoyable and informative. If you appreciated this blog, please follow and click the 👏 button below to show your support. Happy coding! 🚀
Thank you for reading! 💚
