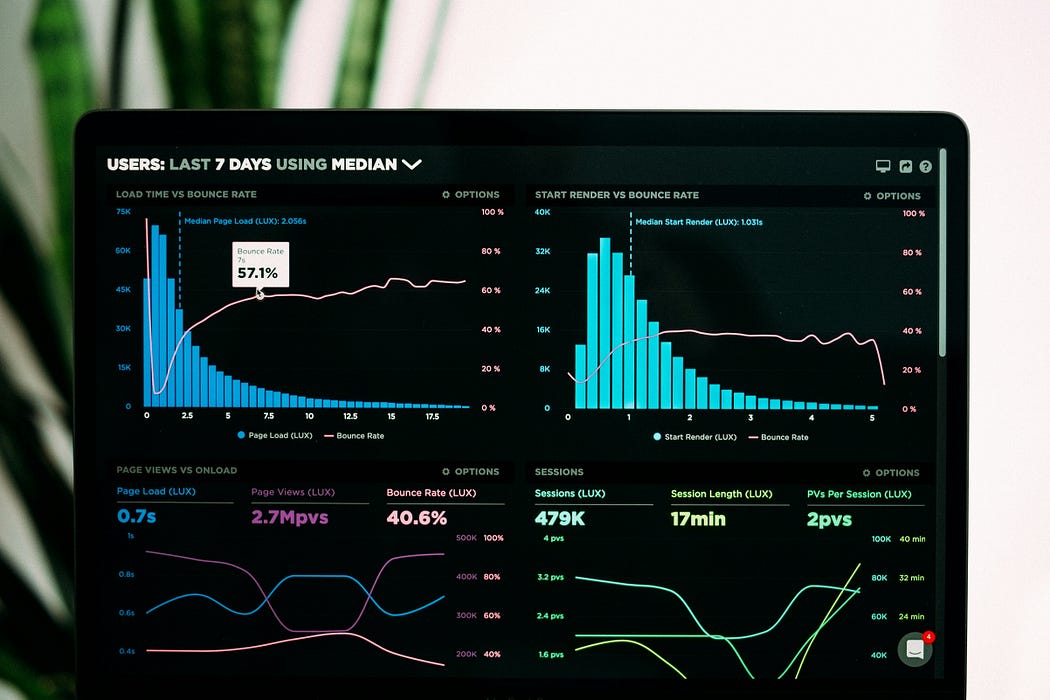
AppOptics is a comprehensive monitoring solution that offers zero-configuration APM, distributed tracing, and detailed infrastructure monitoring. It’s designed to grow with your team, providing real-time insights into application performance, infrastructure health, and custom metrics, all integrated into a unified dashboard. Its extensibility and ease of integration make it a valuable tool for organizations of all sizes.
Navigating the AppOptics Home Page
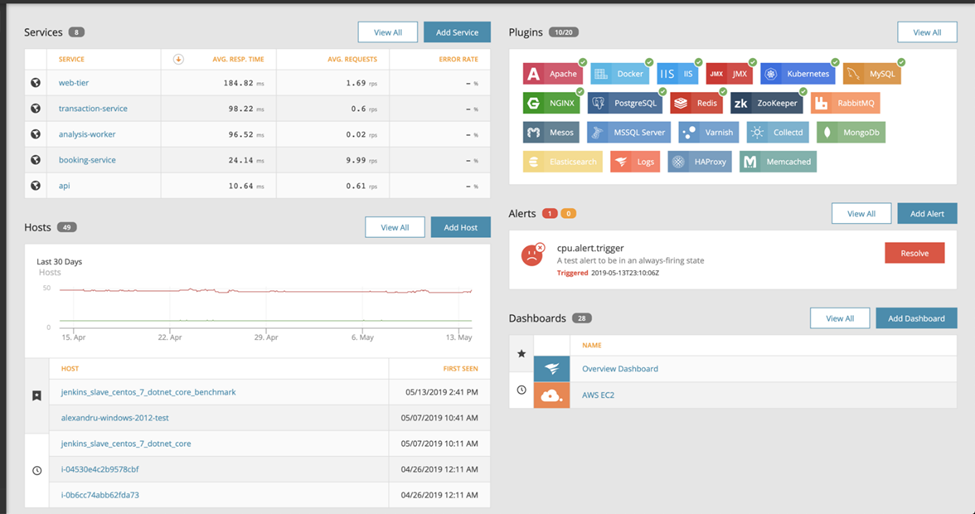
The AppOptics home page provides an overview of the most important elements with intuitive navigation:
- Top Left: Displays the top 5 APM services by response time.
- Hosts Information: Shows a chart of host count trends over time.
- Host Table Tabs: Lists recent hosts and favorites with saved tag sets and preferences.
- Right Side Panel:
- Plugins: Displays available and active plugins.
- Alerts Panel: Shows triggered or recently triggered alerts.
- Dashboards Table Tabs: Lists recent and favorite dashboards.
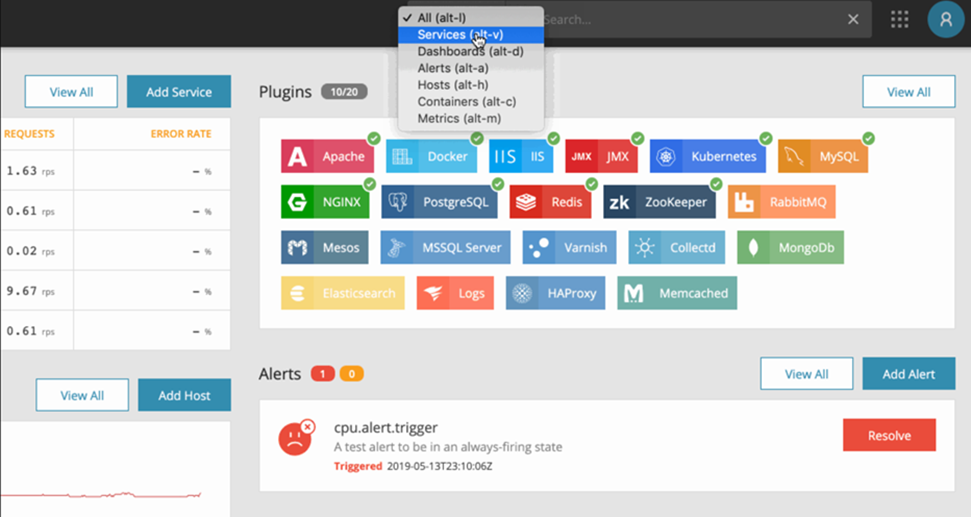
The Global Search feature allows you to search across the entire platform for services, dashboards, alerts, hosts, or metrics. Start typing a search term in the search bar, and the results will include matching services and hosts, with an option to filter by specific categories.
Key Features of AppOptics
1. APM and Distributed Tracing
- Automatic Monitoring: AppOptics agents automatically collect critical performance metrics and generate detailed traces of transactions across services.
- Key Metrics: Track latency, error rates, and transaction metrics for a comprehensive view of application health.
- Distributed Tracing: Visualize the path of requests across your application, including RPC calls and queues, to identify and resolve performance bottlenecks.
- Multi-Language Support: Integrates with various programming languages and libraries for minimal setup.
2. Infrastructure and Log Monitoring
- Host Monitoring: Track CPU, memory, disk usage, and network metrics to ensure optimal infrastructure performance.
- Log Monitoring: Collect and analyze logs to troubleshoot issues by correlating them with performance data.
- Container Monitoring: Monitor resource usage and runtime metrics of containerized applications, differentiating between containers and hosts.
3. Custom Metrics
- Flexible Collection: Submit custom metrics using language bindings, open-source agents, or HTTP POST commands.
- Tags and Aggregation: Filter and group metrics with tags, and use service-side aggregation for detailed analysis.
4. Charts and Dashboards
- Customizable Dashboards: Create and manage dashboards with a grid-based system to visualize performance data.
- Chart Types: Utilize line charts, stacked area charts, and big number charts for effective data representation.
- Annotations: Add context to your data by correlating metrics with specific events.
5. Alerts
- Actionable Alerts: Set alerts based on specific conditions or thresholds, with integration for multiple notification services.
- Metric and Log Alerts: Create alerts for both metrics and log events to comprehensively monitor your systems.
6. User and Organization Management
- Unified Login: Use SolarWinds® Unified Login for seamless access to all SolarWinds Application Management products.
- Role-Based Access: Manage user roles and permissions to control access within your organization.
Getting Started with AppOptics
To get started with AppOptics, follow these steps:
- Sign Up: Create an account on the AppOptics website. You can start with a free 30-day trial to explore its features.
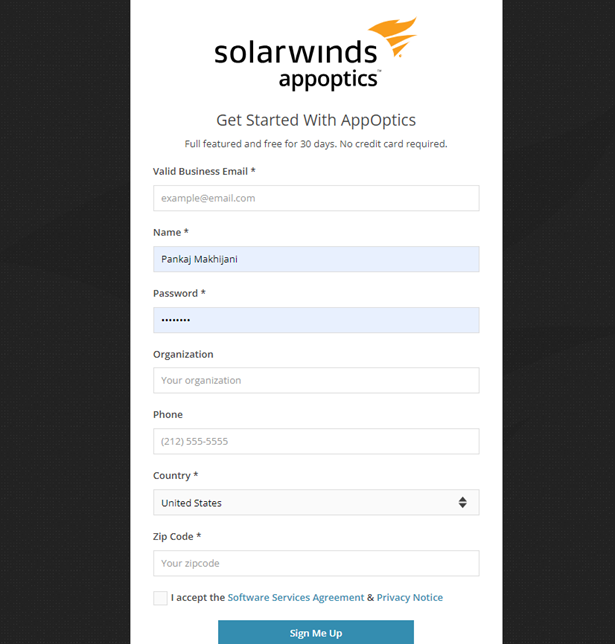
(OPTIONAL) For Organization Use: Request your organization to send an invitation for AppOptics Access.
2. Install Agents: Install the appropriate AppOptics agents for your applications and infrastructure to begin monitoring performance and collecting data.
- Click on ‘Add Service’ and create a new service for your Project.

- Select the language used by your service and click Next.
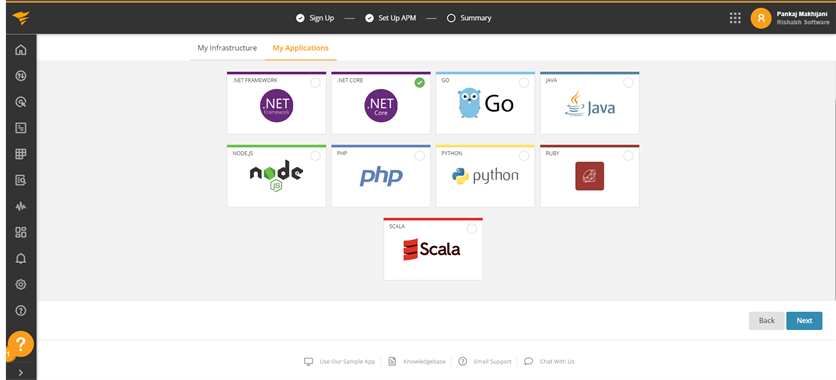
- Next select the Operating System where your application will be deployed.
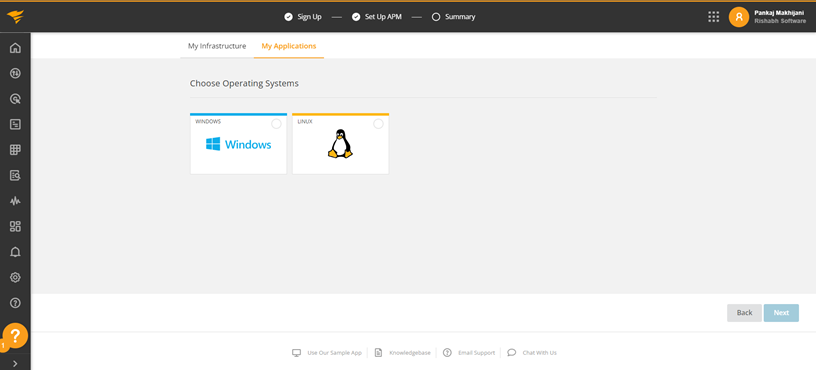
- Add your Service Name.
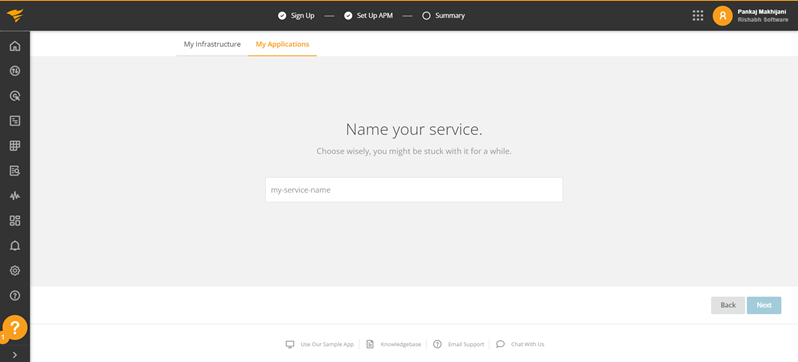
- Now AppOptics will provide you the commands to Install the AppOptics agent for your service along with the APPOPTICS_SERVICE_KEY. Provide these commands to developer to integrate it into service codebase.
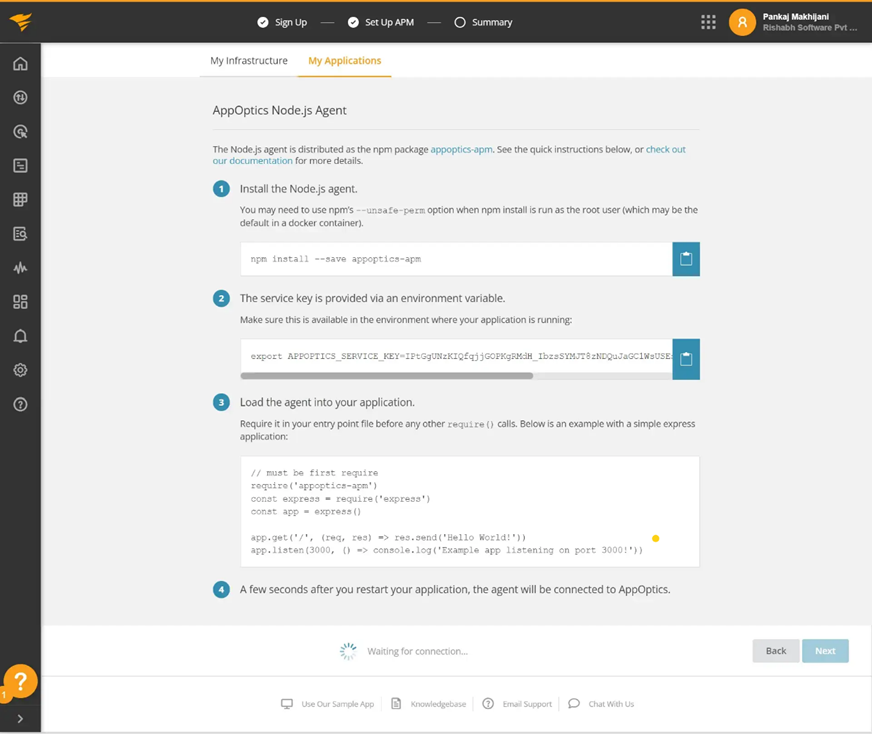
- After executing the provided instructions and deploying your application on the chosen operating system, the AppOptics agent will establish a connection and become operational. Once the agent is set up and connected, you will be able to view and monitor the metrics for your service through the AppOptics platform.
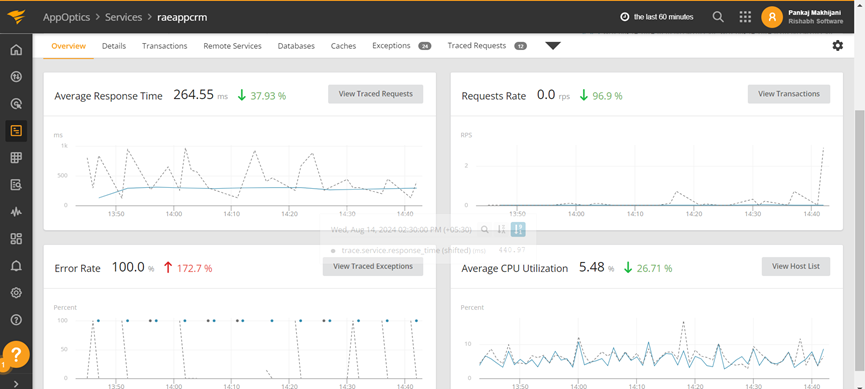
3. Integrate with AWS Account: Integrating AppOptics with your AWS account allows you to automatically pull in CloudWatch metrics and other AWS service data into your AppOptics dashboard. This enables comprehensive monitoring of your AWS infrastructure, giving you deeper insights and enabling better performance management.
- Log in to your AppOptics account and navigate to the Integrations section. This is where you can find a variety of pre-built integrations, including AWS, to streamline the process.
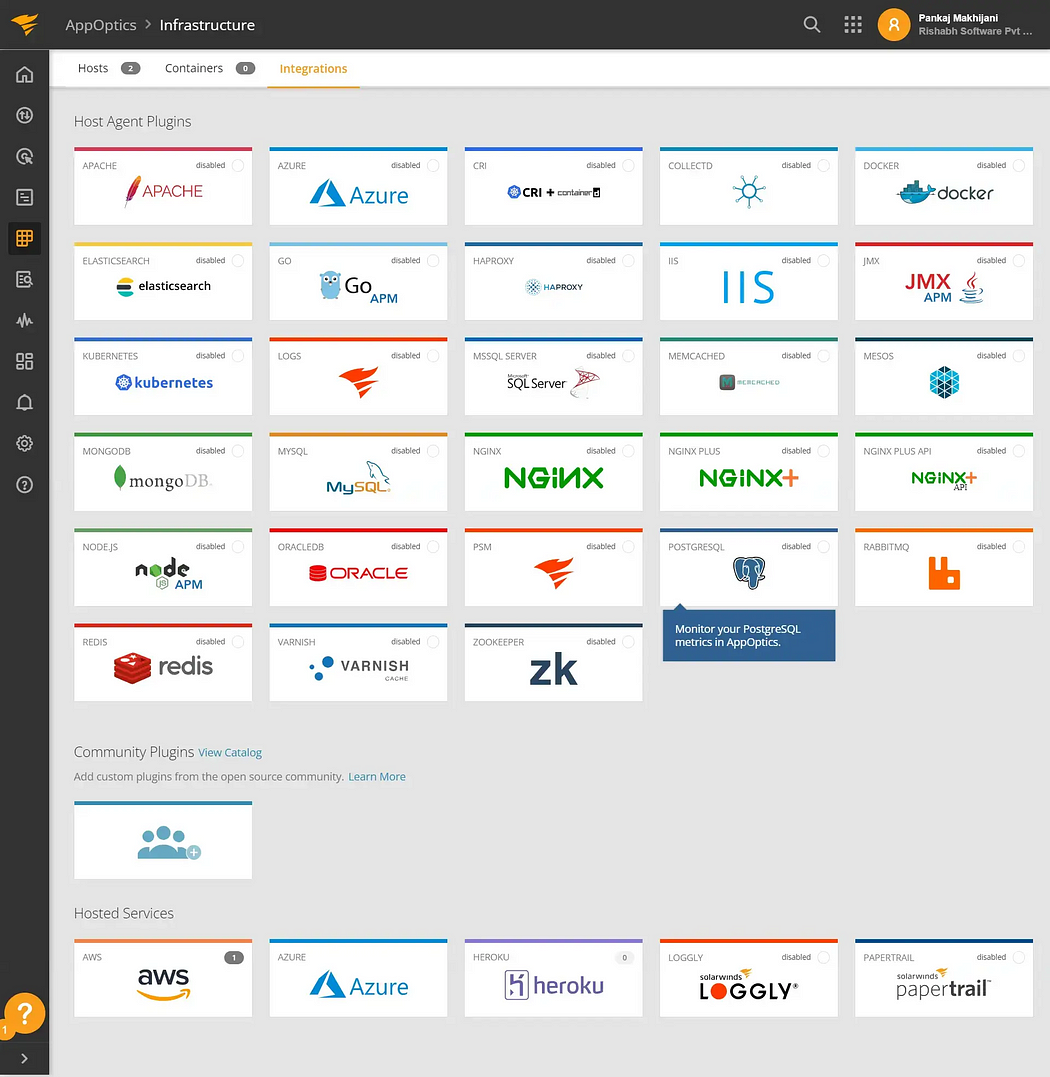
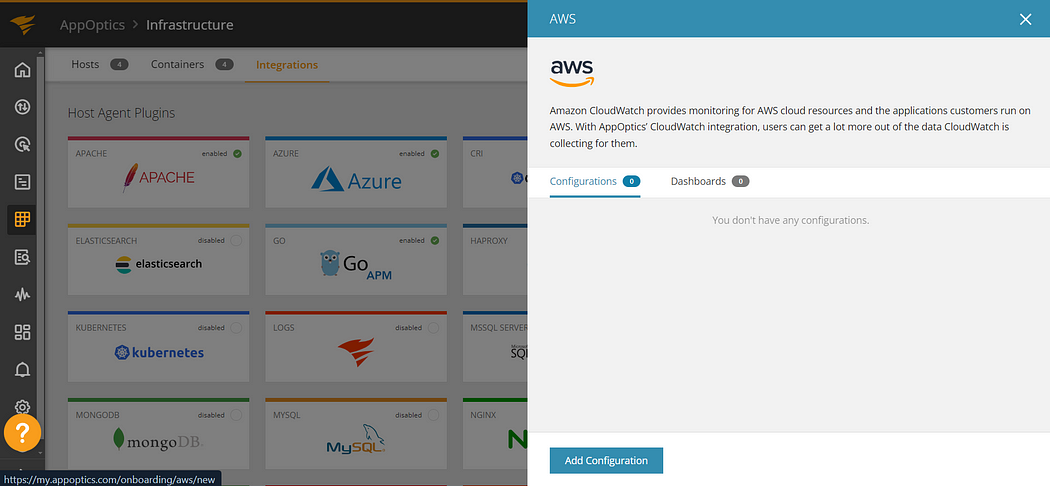
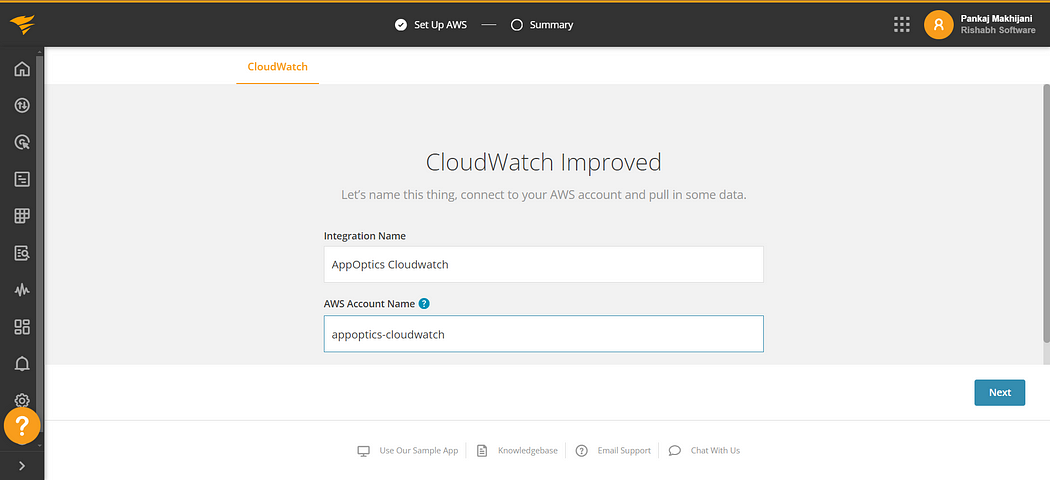
- In the Integrations section, locate and select AWS Integration. Click on Add Configuration to configure AppOptics with your AWS Account.
- Provide an integration name for your AWS configuration.
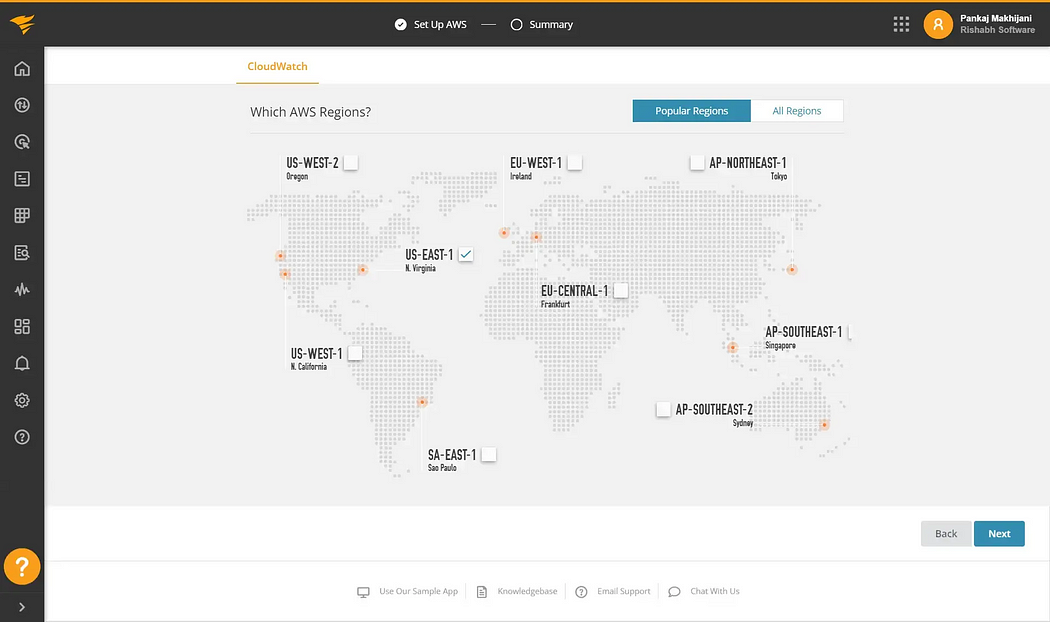
- Select the AWS region to monitor.
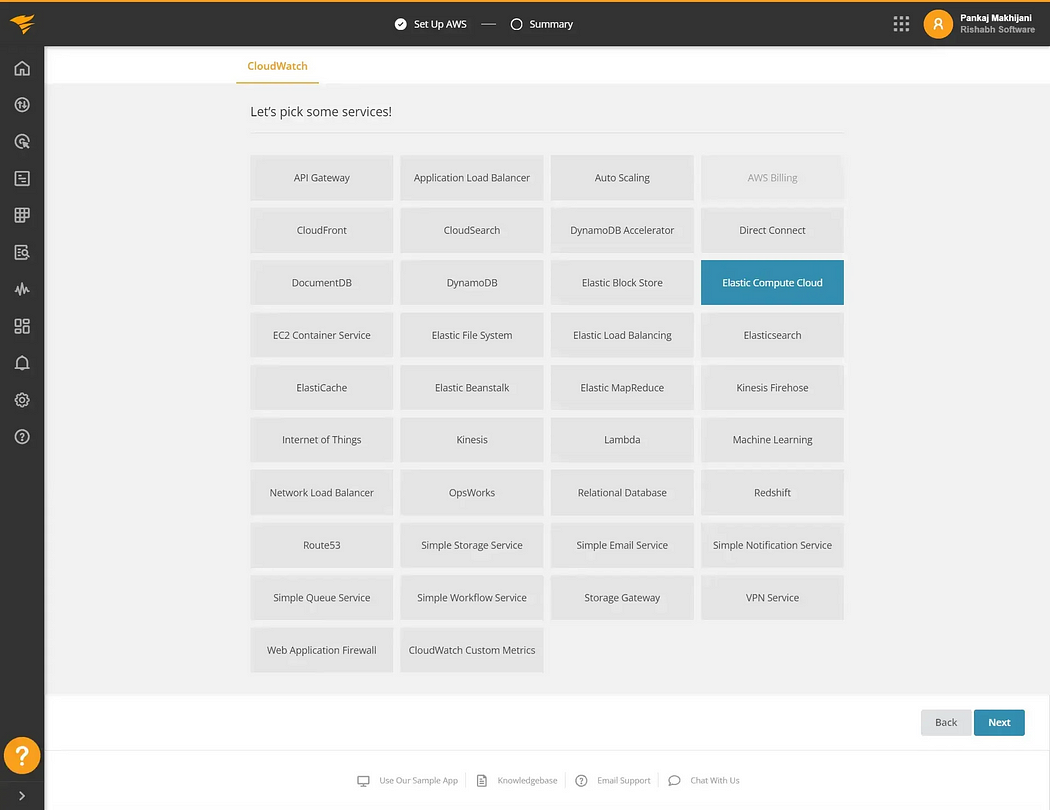
- Select the services that you want to monitor from the list of services.
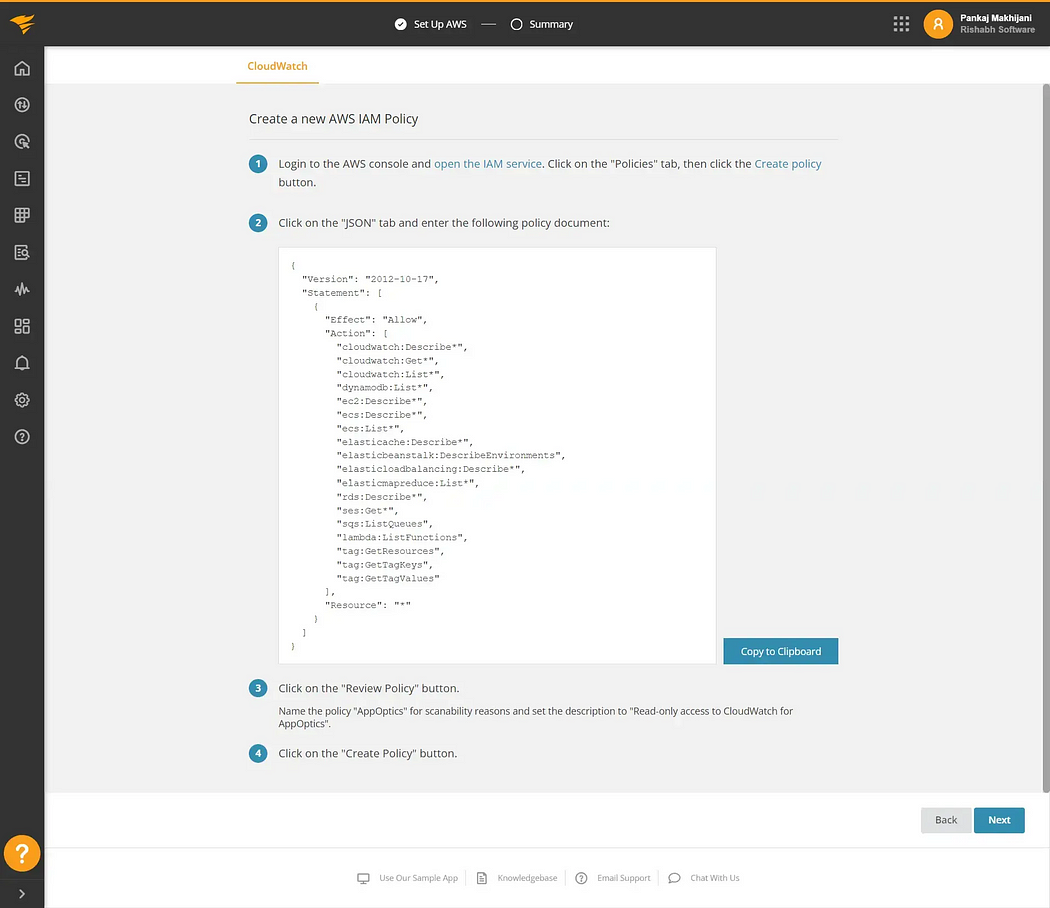
Follow the given steps to create a new IAM policy and IAM role to integrate AppOptics with your AWS account.
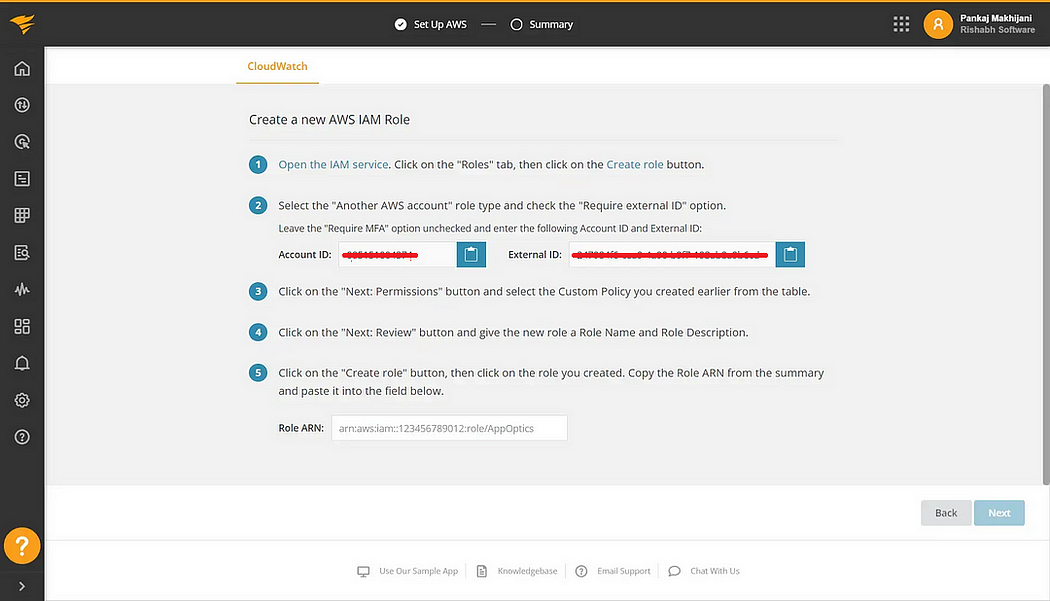
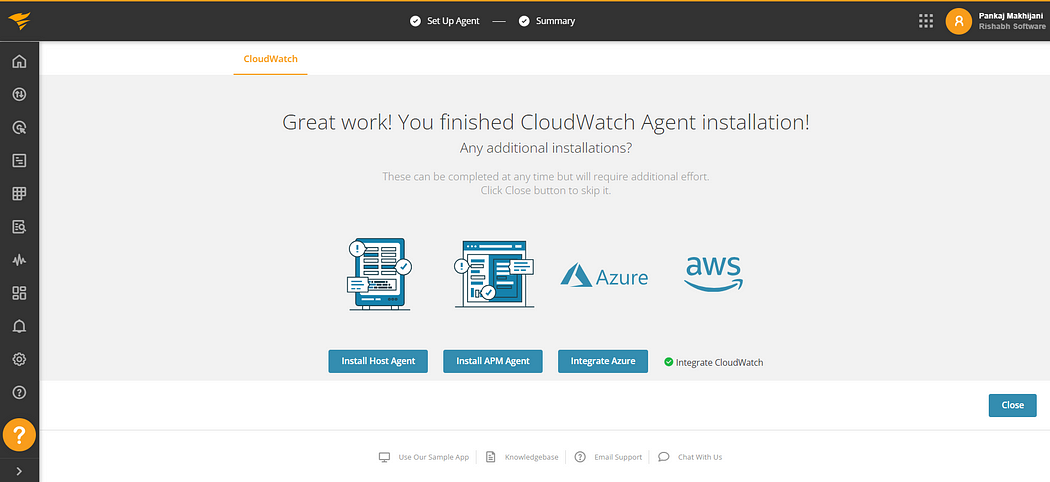
After creating the IAM role and establishing a trust relationship with your AWS account, you’ll see a success message.
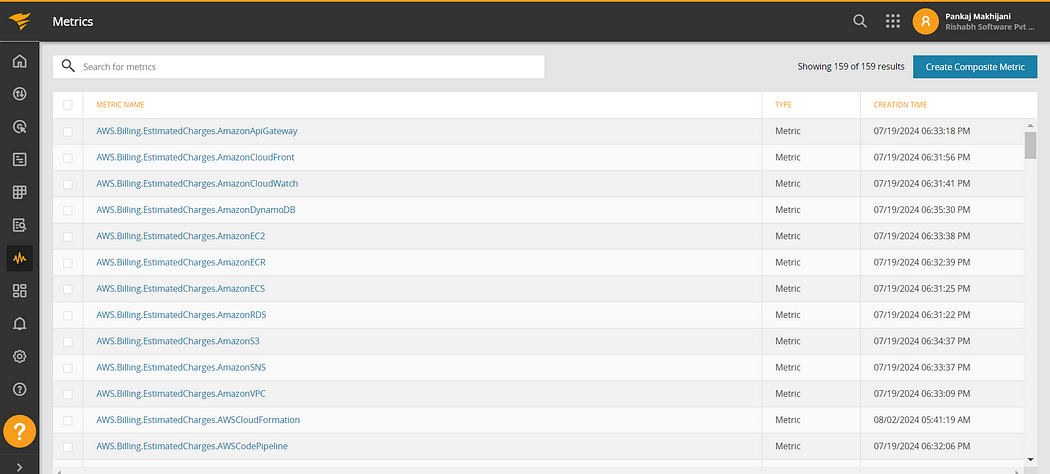
After successful integration, navigate to Metrics tab to view the metrics from your AWS account.
3. Configure Dashboards and Alerts: Once the integration is in place, you can begin setting up custom dashboards and alerts. These tools allow you to visualize and monitor critical metrics from your AWS services and other parts of your infrastructure, ensuring that you have full visibility into the health and performance of your systems.
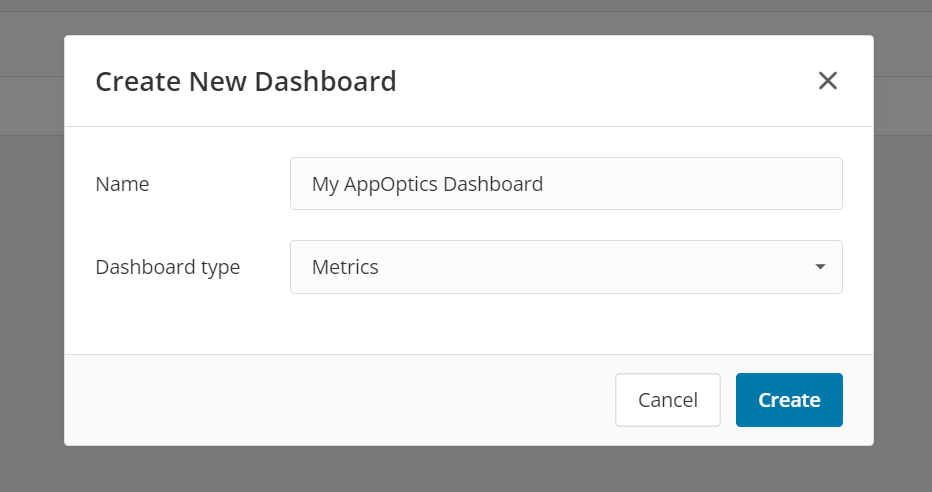
- Navigate to the dashboards tab and click on Create New Dashboard
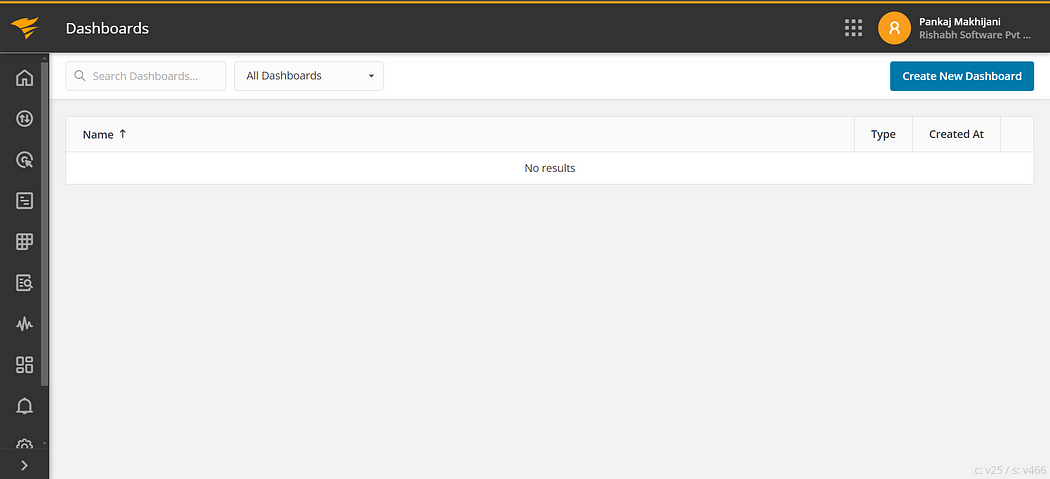
- Provide name to your dashboard and select the dashboard type.
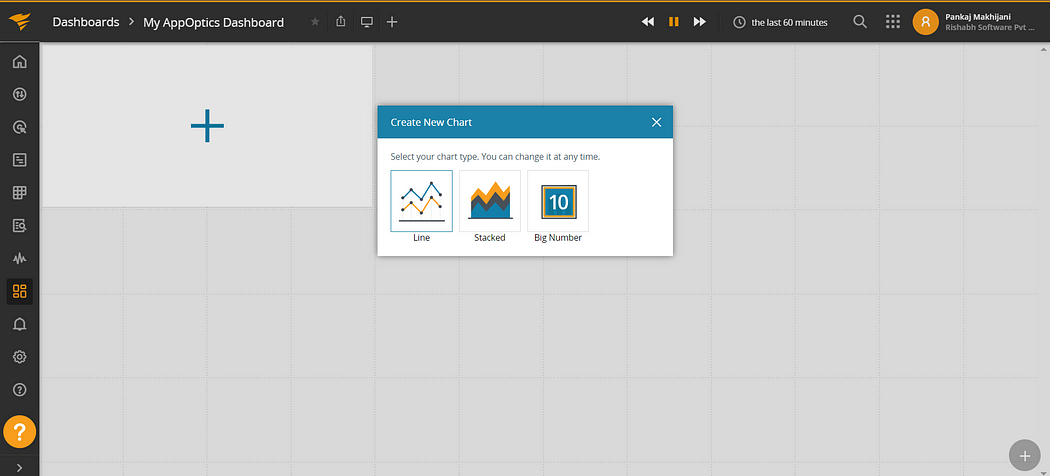
Once Dashboard gets created, click on + icon to create new chart and select the desired chart type. For this demo, we will be using Big Number Chart Type.
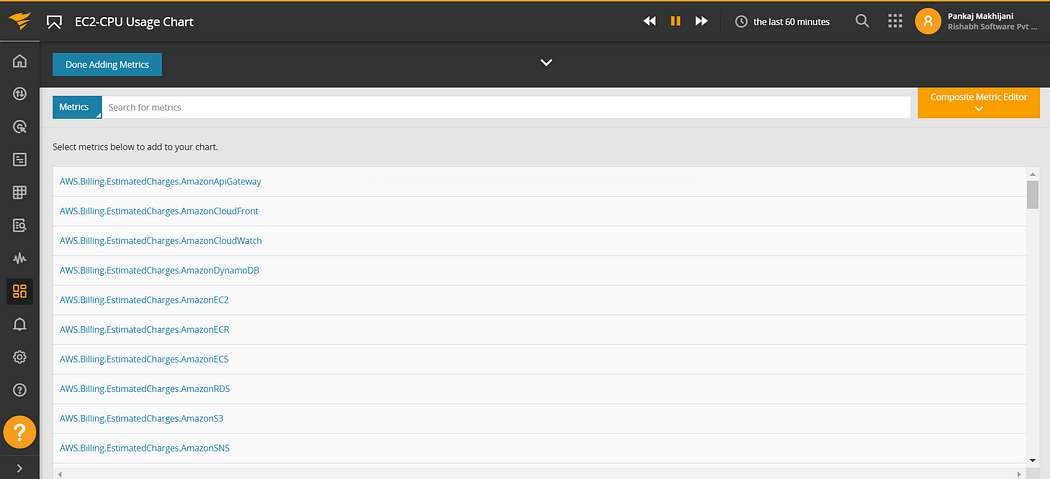
- Provide a name for the chart and select the metric that needs to be monitored.
- For this demo, we will be monitoring CPU utilization for the running EC2 instances in our AWS account. Additionally, you can utilize options such as Graph as, Filter by, and Group by as per your business needs.
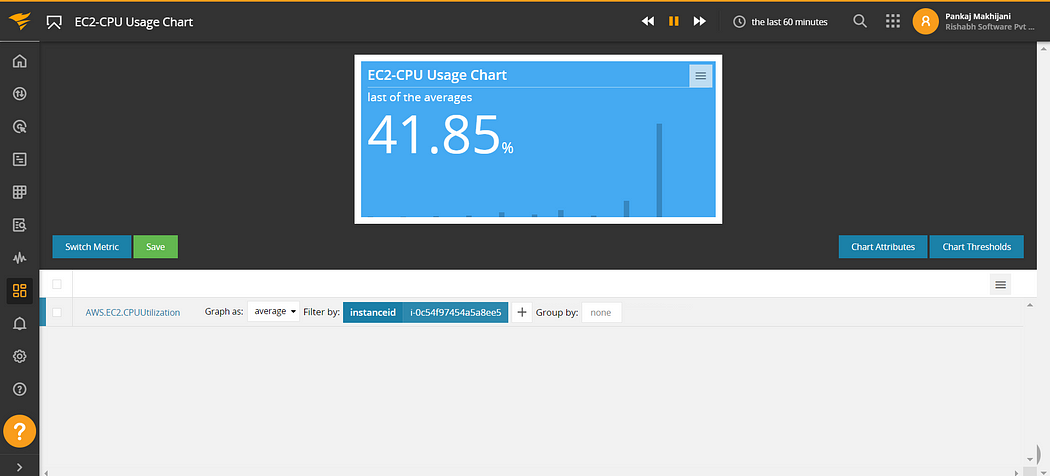
- Once chart is created click on save and your chart will get added on your dashboard.
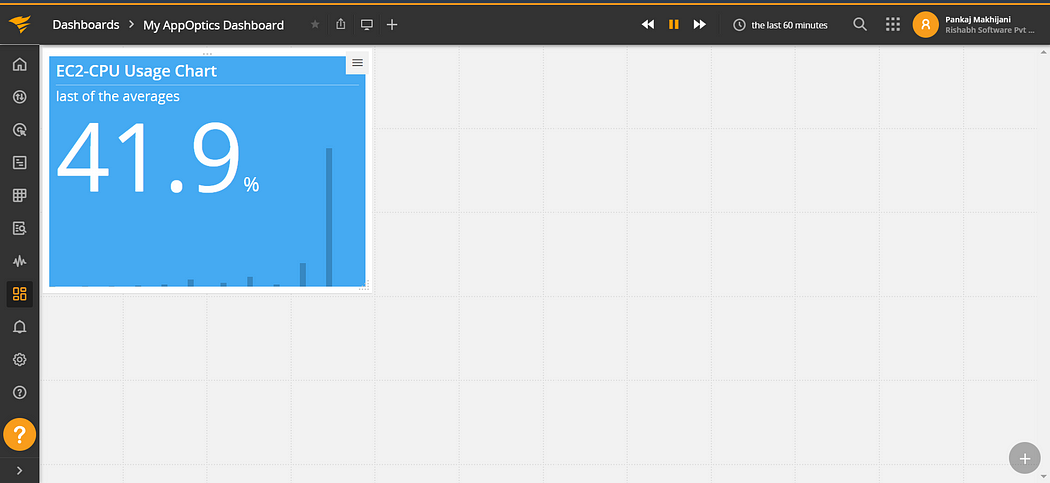
You can add as many metrics as needed based on your business requirements.
Let’s now create an alert to notify us:
- Navigate to Alerts from the Navbar and click on Create Alert.

- Select the Type of metric you want the alert on.
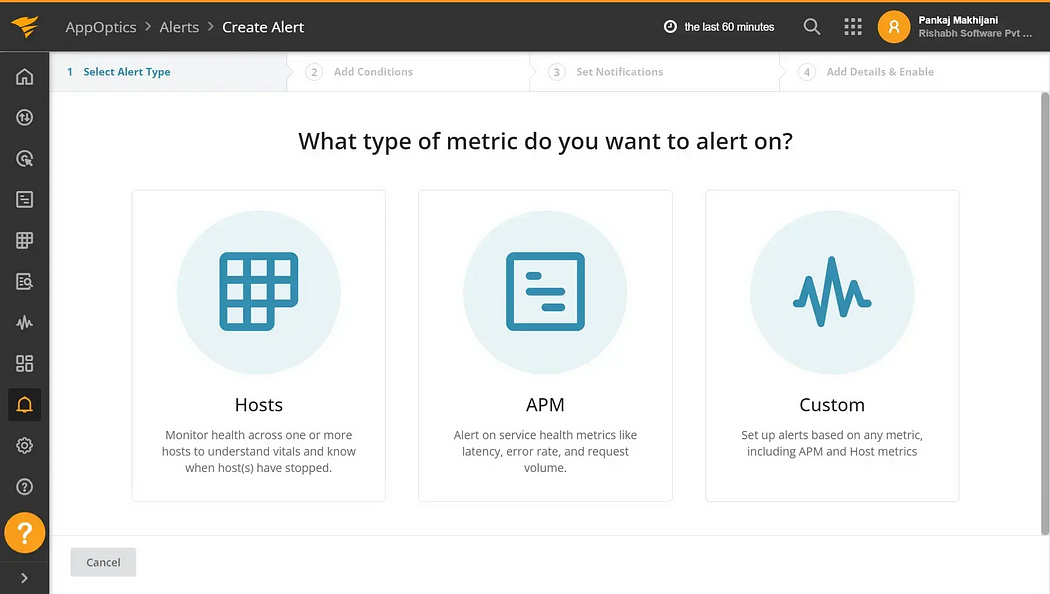
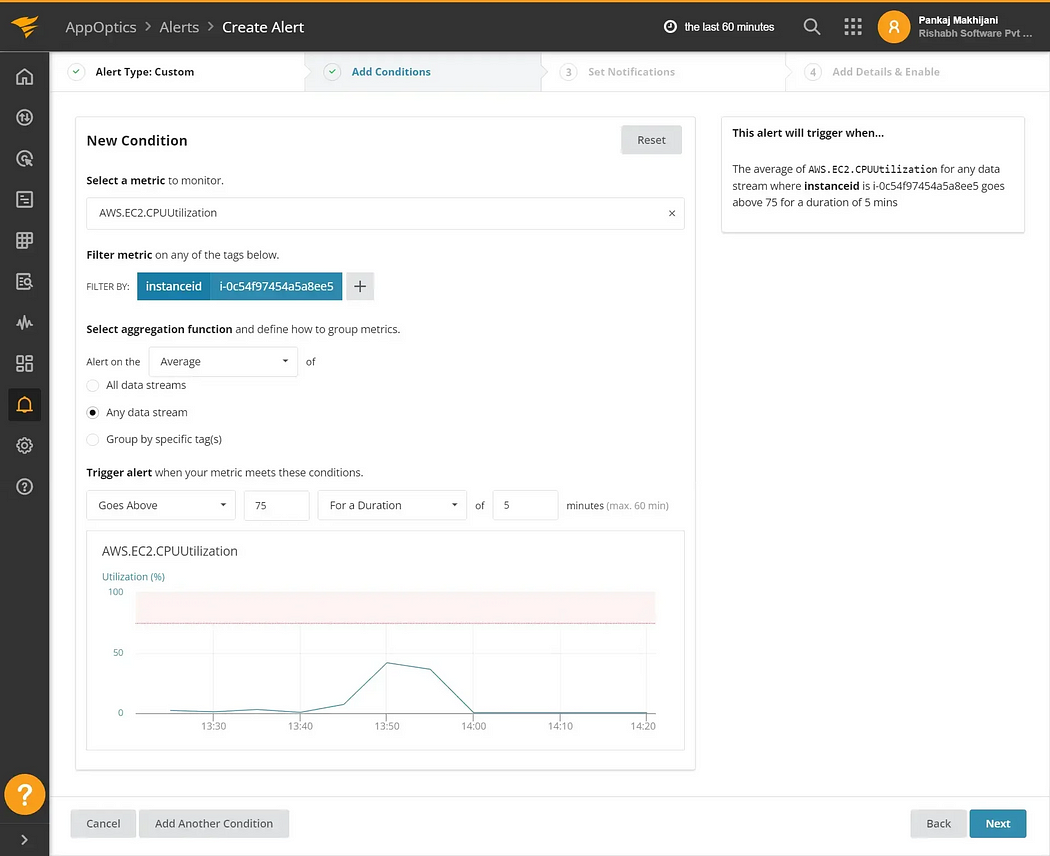
- Select the AWS.EC2.CPUUtilization metric and set the condition to trigger the alert.
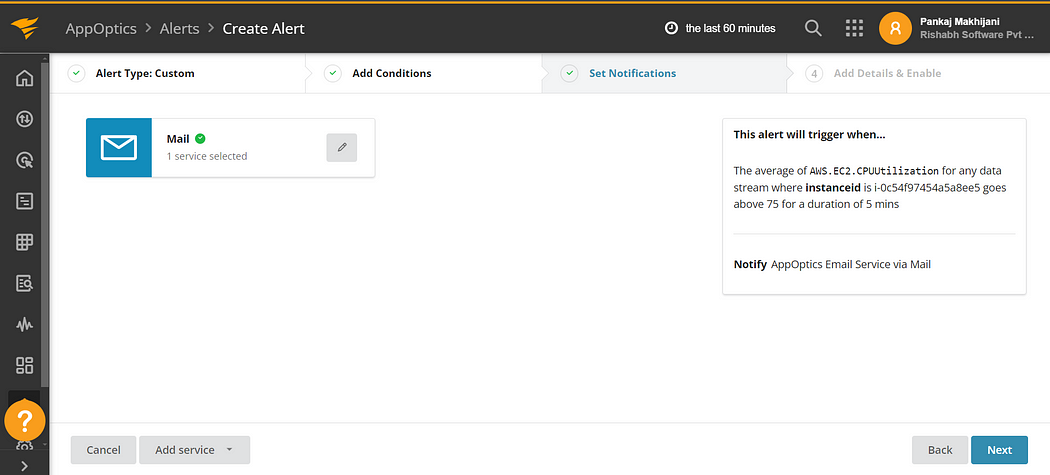
- Click Next and add the service for sending notifications. For this demo, we will be using the Mail service, but you can select the service of your choice from the list.
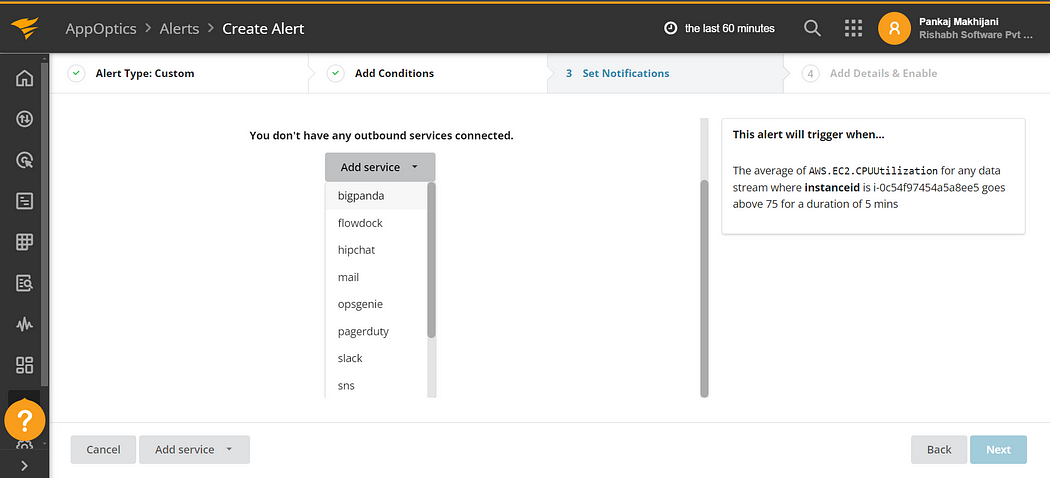
- Provide a name for your Mail service and add the email addresses to send the notifications to.
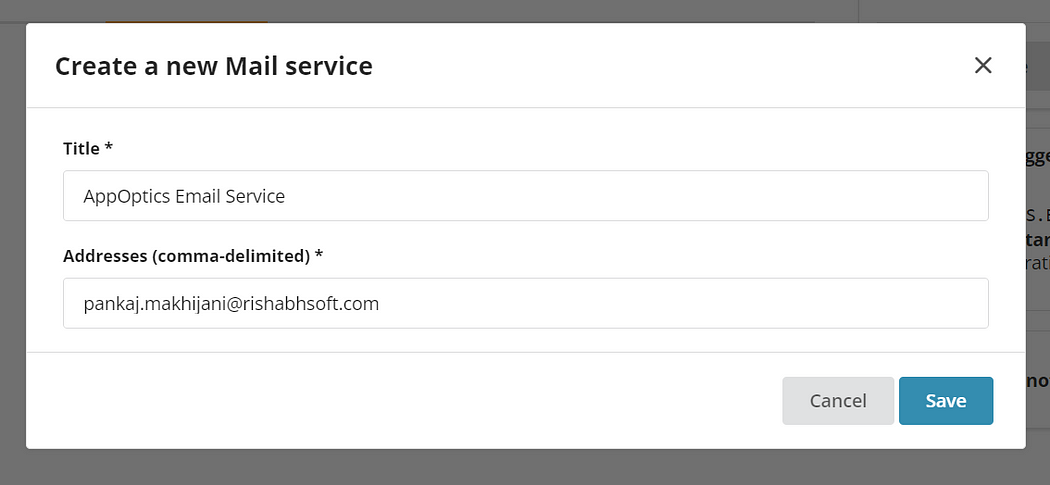
- Once the service is created, select the service and click Next.
- Add details for your alert.
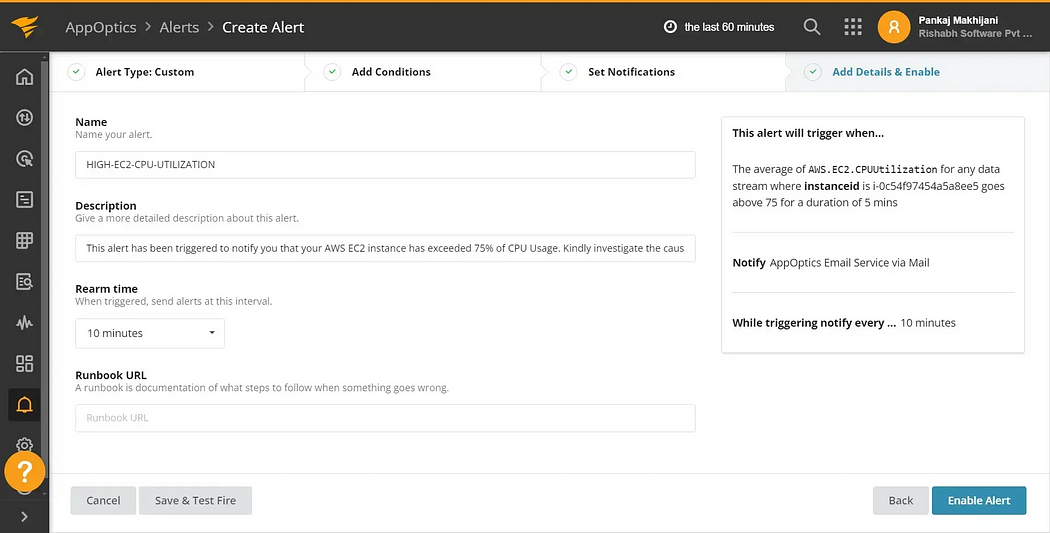
- Once the details are added, click on Enable Alert, and your alert is now ready.
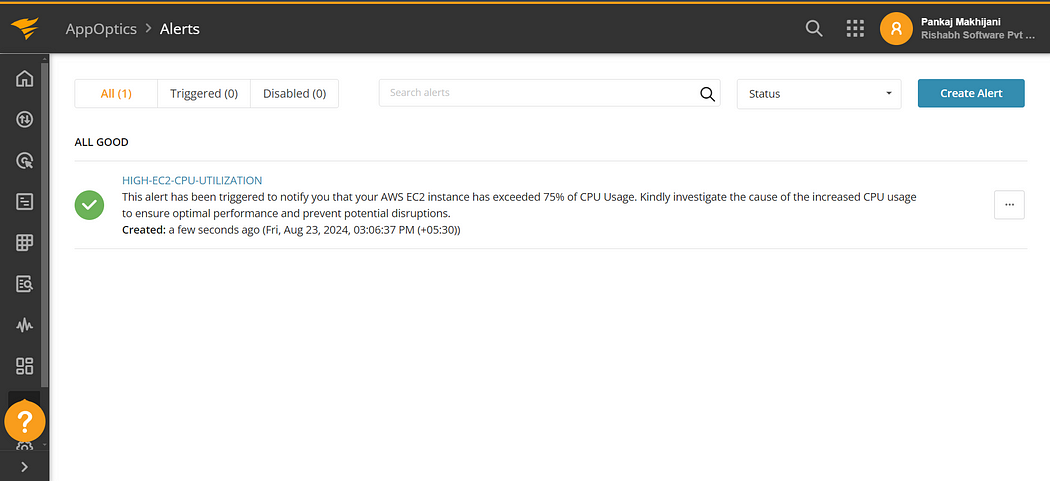
Our alert is now set up and will notify you whenever your resource exceeds the specified CPU utilization threshold. Optionally, you can also click on the created alert and test it by clicking on Test Fire.
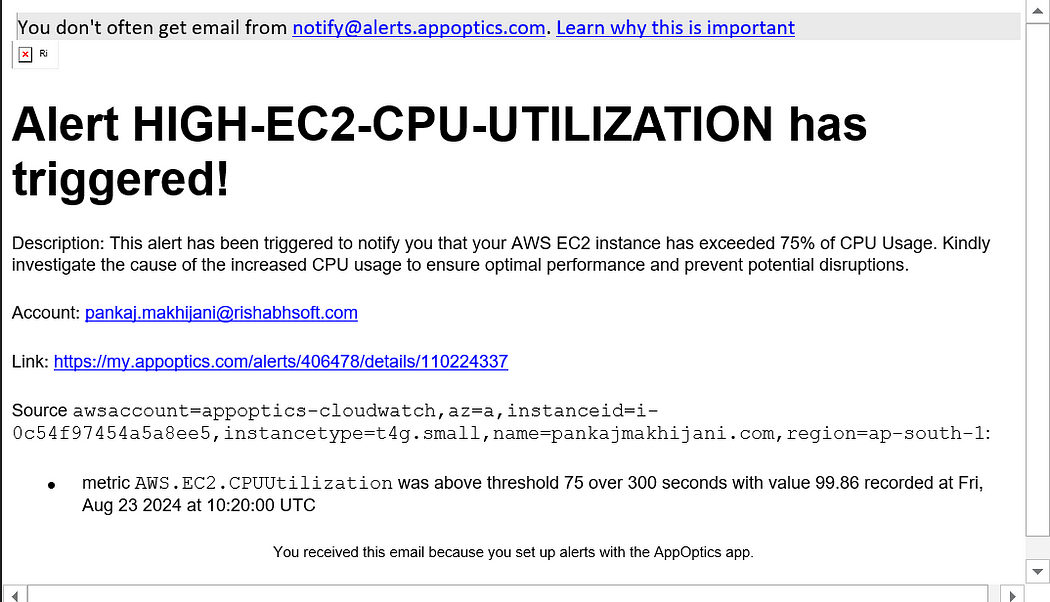
Hurray 🎉 We have now successfully created Dashboards and Alerts to monitor our resources and send us notifications in case of any service disruption.

Conclusion
In this blog, we’ve delved into how to get started with AppOptics, covering its integration with AWS, and how to set up dashboards and alerts for comprehensive monitoring. By harnessing the power of AppOptics, you can gain real-time insights into application performance and infrastructure health, ultimately enhancing your ability to manage and optimize your systems effectively.
I hope you found this content informative and enjoyable. For more blogs and updates, please consider following and clicking the 👏 button below to show your support. Happy coding! 🚀
Thank you for reading! 💚
