Assume that it’s the festive season and you own an e-commerce company. It’s 12’o clock, and your big festive sale has just begun. Customers are flocking to your website to grab the best deals. Everything’s going great — until, out of nowhere, your app crashes. Suddenly, your customers can’t access your site, and your sales are dropping fast.

You got to hear about this incident and you’re left scratching your head, wondering why did this happen? & how it can be fixed?.
But here’s the worst part: you have no idea what went wrong because you didn’t have any monitoring in place to track the app’s performance.

Now, imagine if you had a monitoring tool like New Relic in place. Instead of frantically guessing what caused the crash, you’d have clear, real-time insights into exactly what went wrong.

With New Relic, you could pinpoint whether the issue was a sudden spike in traffic, a database query that slowed down, or a server that couldn’t handle the load. Having this visibility would allow you to act quickly and effectively to get your app back online — minimizing downtime and protecting your sales.
This sounds pretty reassuring, right? Having these practices in place gives you peace of mind and helps you stay in control of your app, especially when things get busy. When you learn about New Relic, a tool designed to help monitor your app’s performance, you’ll feel even more confident. By adding it to your system, you’ll see for yourself how it makes monitoring and improving your app’s performance easier and more effective.
Now that you’re starting to see the value of having monitoring in place, let’s dive into what New Relic actually is and make our hands dirty with this.
What is New Relic?
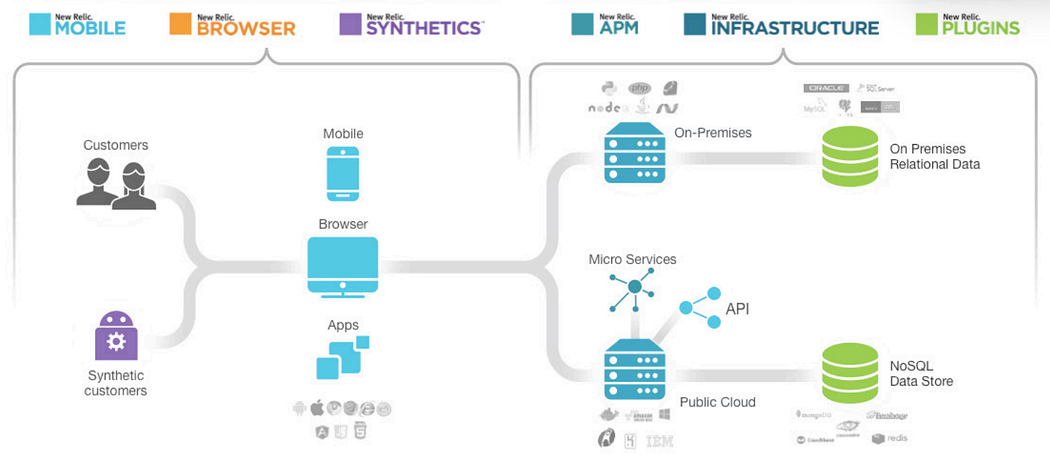
New Relic is a web-based software platform used for full-stack monitoring. It enables you to monitor applications, infrastructure, web browsers, and other components all from a single platform. This tool tracks and provides real-time performance details of your web application, allowing developers to analyze the data and understand the root causes of performance issues.
Among its many features, New Relic is most well-known for its Application Performance Monitoring (APM). As a software-as-a-service (SaaS) solution, you can easily access and utilize its features through a web browser.
New Relic supports a wide range of programming languages, including PHP, Java, Python, and Ruby. It also integrates seamlessly with cloud services like Microsoft Azure and Amazon Web Services (AWS), making it a flexible tool for both on-premise and cloud environments.
Key Features of New Relic
1. Application Performance Monitoring (APM)
- Real-time tracking of your application’s performance at the code level.
- Helps identify slow transactions, errors, and bottlenecks, allowing you to optimize your app’s speed.
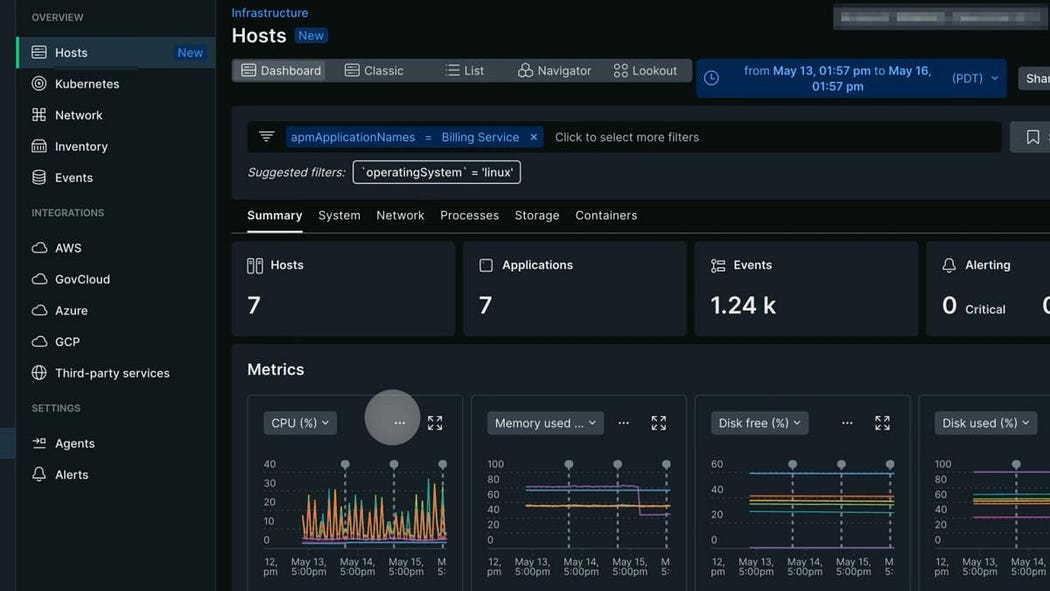
2. Infrastructure Monitoring
- Monitors your servers, virtual machines, containers, and cloud environments.
- Tracks metrics like CPU, memory usage, and network performance to ensure infrastructure health.
3. Real-time Dashboards
- Visualizes key metrics and performance data in customizable, real-time dashboards.
- Helps you quickly assess your app’s health and track performance over time.
4. Error Tracking
- Captures and categorizes errors in your app, so you can troubleshoot and fix them quickly.
- Identifies the root causes and prioritizes which issues to address first.
5. Distributed Tracing
- Tracks requests across various components and services of your application.
- Helps identify slow or failed requests and understand performance at each step.
6. Log Management
- Collects, stores, and analyzes log data from your app, servers, and infrastructure.
- Enables efficient troubleshooting by viewing logs alongside metrics and traces.
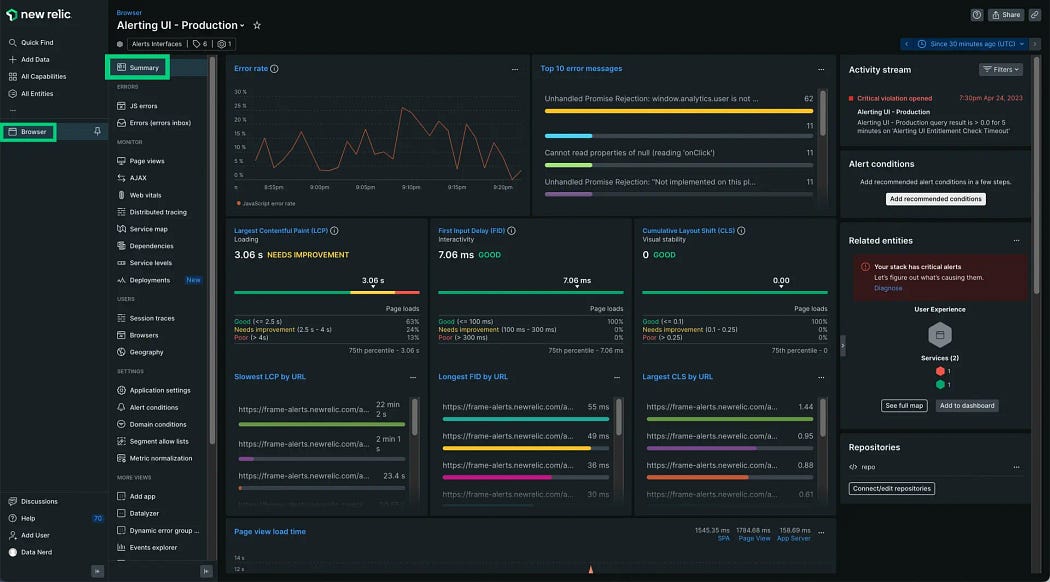
7. Real User Monitoring (RUM)
- Measures the performance of your app from the user’s perspective, including front-end interactions.
- Helps optimize user experience by identifying performance issues on the client side.
8. Synthetic Monitoring
- Simulates user interactions with your app to test its availability and performance.
- Helps monitor uptime and performance in different geographies before real users interact.
9. Mobile Monitoring
- Tracks the performance of mobile apps, including crashes, slowdowns, and network errors.
- Provides insights into how your mobile app performs across different devices and networks.
10. Alerts & Notifications
- Configurable alerts that notify you of issues based on predefined thresholds.
- Integrates with tools like Slack, email, and PagerDuty to keep you informed about app status in real time.
11. AI-powered Insights
- Uses machine learning to provide proactive suggestions for optimizing performance.
- Analyzes trends and anomalies in data to help you predict and resolve potential issues.
These features make New Relic a comprehensive monitoring tool that helps developers and businesses optimize performance, troubleshoot issues, and ensure seamless user experiences.
How New Relic Works?
To understand how New Relic functions, let’s take a closer look at the key data types it uses for monitoring:
New Relic functions by collecting and analyzing key data types for monitoring. These data types are commonly referred to as MELT:
1. Metrics
- Numerical measurements of performance, such as load time, CPU usage, and memory consumption.
- Helps monitor the overall health of applications and infrastructure.
2. Events
- Tracks specific actions or activities, such as user logins or database queries.
- Provides context for understanding what’s happening inside the app.
3. Logs
- Detailed records of events with timestamps.
- Offers a precise trail of actions leading up to performance issues.
4. Traces
- Timelines of events showing their sequence and interrelations.
- Pinpoints bottlenecks or delays across application components.
How New Relic Collects Data?
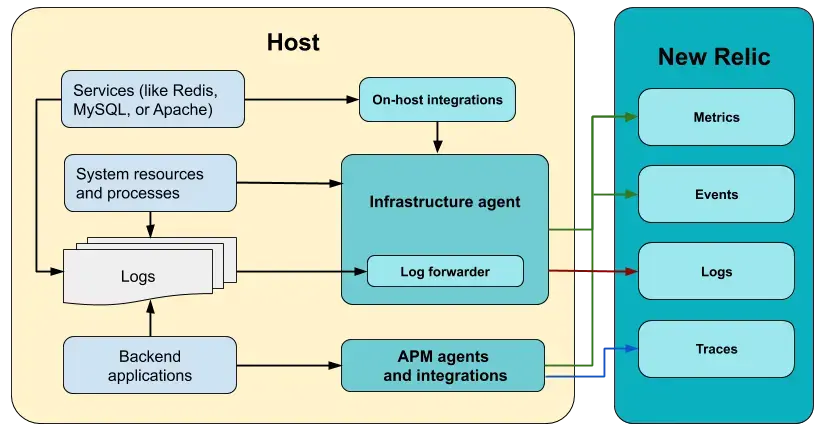
New Relic uses agents to collect data from your application. These agents are small pieces of code installed directly in your app or virtual server. The agents monitor the performance of your app and send data back to New Relic’s cloud platform.
There are different agents for different tasks:
- Application Monitoring Agent: Tracks the performance of your app, including code-level metrics and database interactions.
- Infrastructure Monitoring Agent: Monitors the health and performance of your servers and cloud infrastructure.
- Browser Monitoring Agent: Measures the performance of your app’s front-end and user interactions within web browsers.
The data gathered by these agents is sent to New Relic, where it is processed and displayed on a user-friendly dashboard.
Practical Hands-On Implementation
Application Monitoring
Step 1: Create an Account
- Sign up for a free account on the New Relic website.
- Choose a free or pay-as-you-go plan based on your requirements.
Step 2: Install the Agent
- Download the appropriate New Relic agent for your application’s programming language (e.g., Java, Python, Node.js).
- Follow the installation guide provided for each language on New Relic’s documentation site.
# Example: Installing the Node.js Agent
npm install newrelic --save
Step 3: Configure the Agent
- Add your license key to the agent’s configuration file. For example:
/* newrelic.js */
exports.config = {
  app_name: ['Your App Name'],
  license_key: 'YOUR_LICENSE_KEY',
  logging: {
    level: 'info',
  },
};
Step 4: Deploy Your Application
- Restart your application to ensure the agent starts sending data to New Relic.
- Log in to your New Relic dashboard to verify the data ingestion.
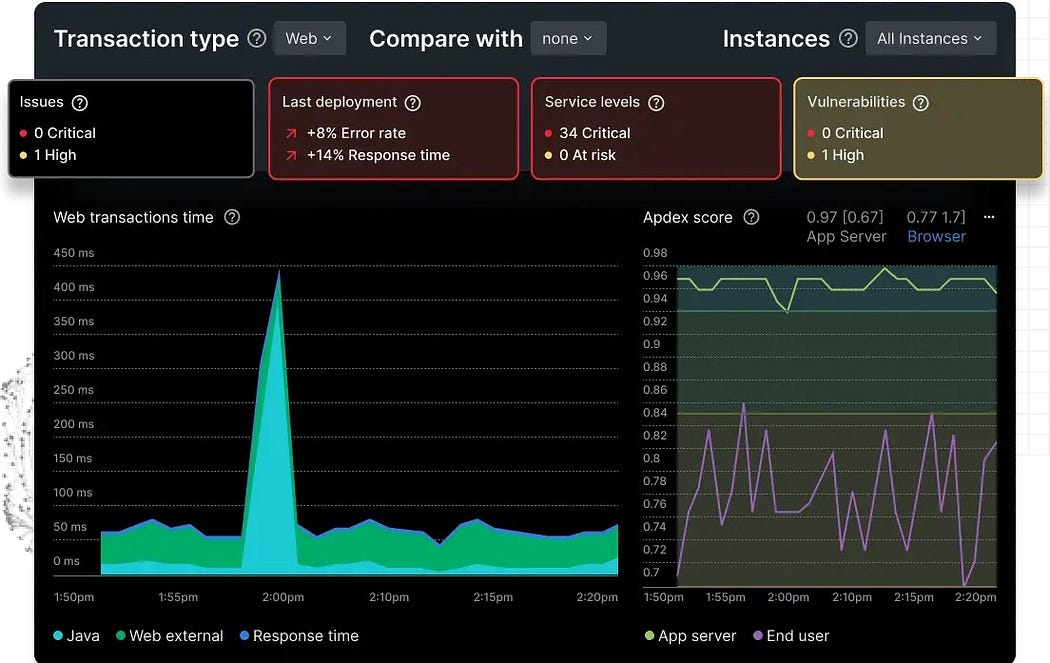
Step 5: Monitor and Optimize
- Use the APM dashboard to track transactions, errors, and bottlenecks.
- Set up alerts to get notified of performance issues.
Infrastructure Monitoring
Step 1: Install the Infrastructure Agent
- Download the infrastructure monitoring agent for your server’s operating system (e.g., Linux, Windows).
- Follow the setup instructions from the New Relic documentation.
# Example: Installing on Ubuntu
curl -Ls https://download.newrelic.com/infrastructure_agent/gpg/newrelic-infra.gpg | sudo apt-key add -
echo "deb [arch=amd64] https://download.newrelic.com/infrastructure_agent/linux/apt focal main" | sudo tee -a /etc/apt/sources.list.d/newrelic-infra.list
sudo apt-get update && sudo apt-get install newrelic-infra -y
Step 2: Configure the Agent
- Add the license key to the agent’s configuration file:
# /etc/newrelic-infra.yml
license_key: YOUR_LICENSE_KEY
Step 3: Start Monitoring
- Start the New Relic infrastructure agent:
sudo systemctl start newrelic-infra- Verify the data ingestion on the Infrastructure dashboard.
Browser Monitoring
Step 1: Enable Browser Monitoring
- Log in to your New Relic dashboard and navigate to Browser Monitoring.
- Copy the JavaScript snippet provided by New Relic.
Step 2: Add the Snippet to Your Web App
- Paste the JavaScript snippet in the
<head>section of your HTML files.
<head>
  <script type="text/javascript">
    // New Relic Browser Monitoring script
    (function(n,e,w,r){if(!e){e=w.createElement("script");e.async=!0;e.src="https://js-agent.newrelic.com/nr-spa-1234.min.js";r=w.getElementsByTagName("script")[0];r.parentNode.insertBefore(e,r);}})(window,document);
  </script>
</head>
Step 3: Monitor Front-End Performance
- Open your New Relic dashboard to view performance metrics such as page load times, JavaScript errors, and user interactions.
Costing Factors for Using New Relic
New Relic offers flexible pricing plans based on your app’s size and needs:
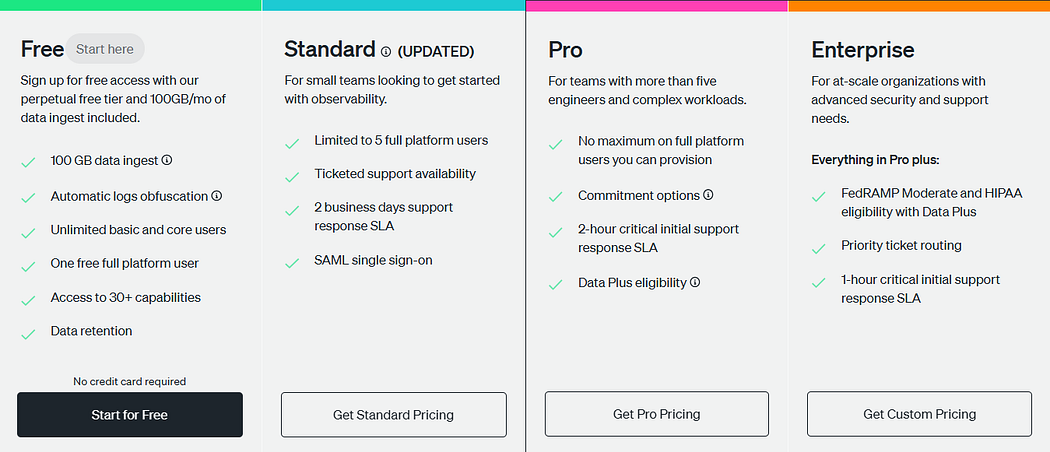
Free Plan
- Data Ingest: 100 GB per month.
- Users: One free full platform user; unlimited basic and core users.
- Features: Access to over 30 capabilities, including real-time dashboards and AI-powered insights.
- Data Retention: Limited.
Standard Plan
- Users: Up to five full platform users.
- Support: Ticketed support with a 2-business-day response SLA.
- Single Sign-On: SAML integration.
- Data Ingest: Beyond the free 100 GB, additional data is billed at $0.30 per GB.
Pro Plan
- Users: No limit on full platform users.
- Support: 24/7 availability with a 2-hour critical initial response SLA.
- Single Sign-On: SAML integration.
- Data Ingest: Beyond the free 100 GB, additional data is billed at $0.30 per GB.
- Commitment Options: Available for discounted rates.
- Data Plus Eligibility: Access to advanced data capabilities.
Enterprise Plan
- Users: No limit on full platform users.
- Support: 24/7 availability with a 1-hour critical initial response SLA.
- Single Sign-On: SAML integration.
- Data Ingest: Beyond the free 100 GB, additional data is billed at $0.30 per GB.
- Commitment Options: Available for discounted rates.
- Data Plus Eligibility: Access to advanced data capabilities.
- Advanced Security: FedRAMP Moderate and HIPAA eligibility with Data Plus.
- Priority Support: Priority ticket routing.
This pricing structure allows businesses to scale based on their app’s growth while maintaining cost control.
NOTE: For detailed and up-to-date information, please refer to New Relic’s official pricing page.
Conclusion
New Relic offers vital, real-time insights into your app’s performance, infrastructure, and user interactions. With features like real-time dashboards and AI-driven insights, it helps you monitor and optimize your app seamlessly.
By implementing New Relic, you ensure your app is ready for high-traffic events like festive sales, preventing crashes and performance issues. With New Relic, you can confidently manage your app’s performance, even during the busiest times.
I hope you found this content informative and enjoyable. For more insightful blogs and updates, consider following and clicking the 👏 button below to show your support. Happy coding! 🚀
Thank you for reading! 💚